
Page History
...
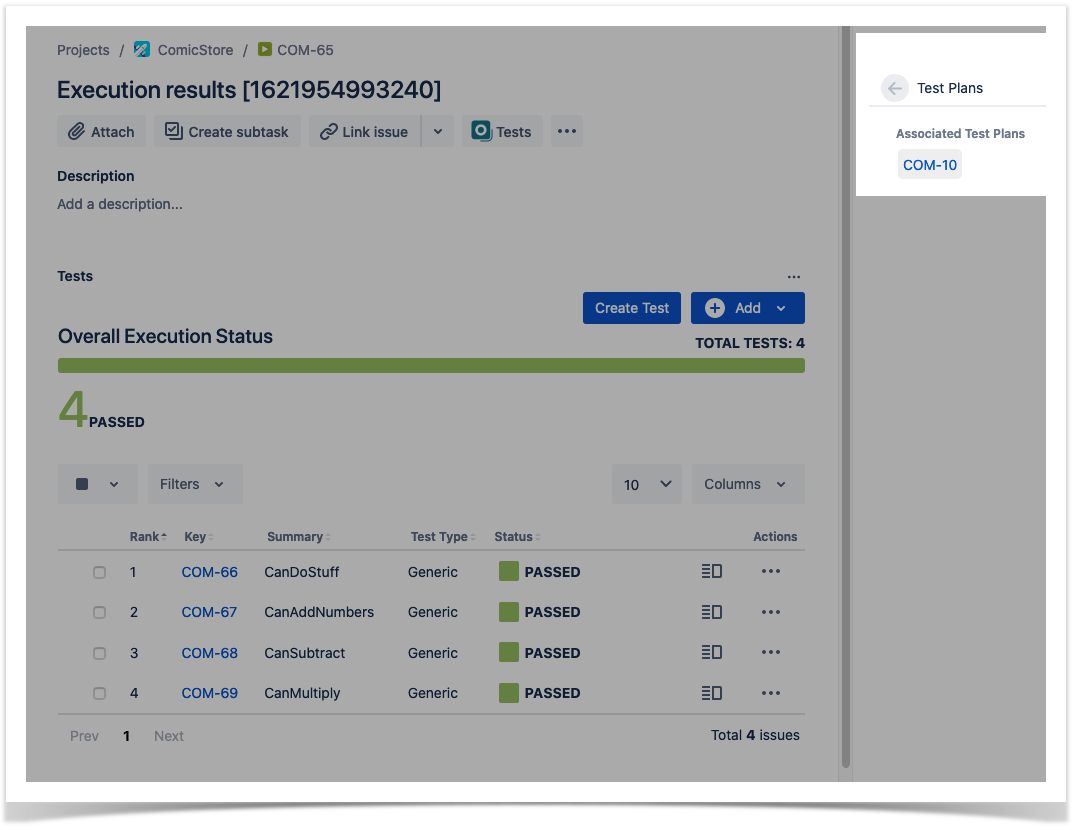
Associated with the Test Plan that we have passed along:
Xray GraphQL
Add custom steps to a manual test
In this simple scenario we are adding manual steps to a Test previously created.
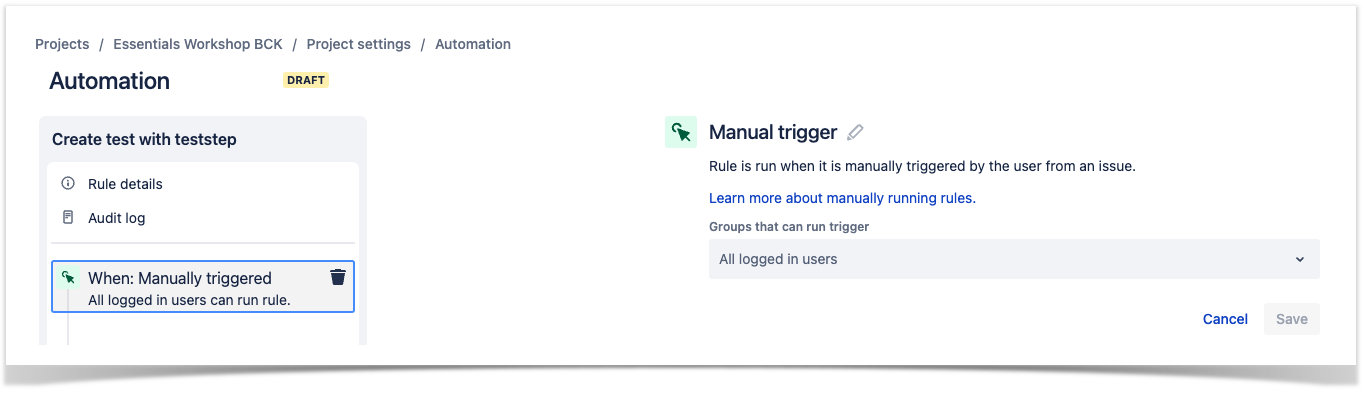
Automation Configuration
- create a new rule and define the "When" (i.e. when it should be triggered ), to be "Manually triggered".
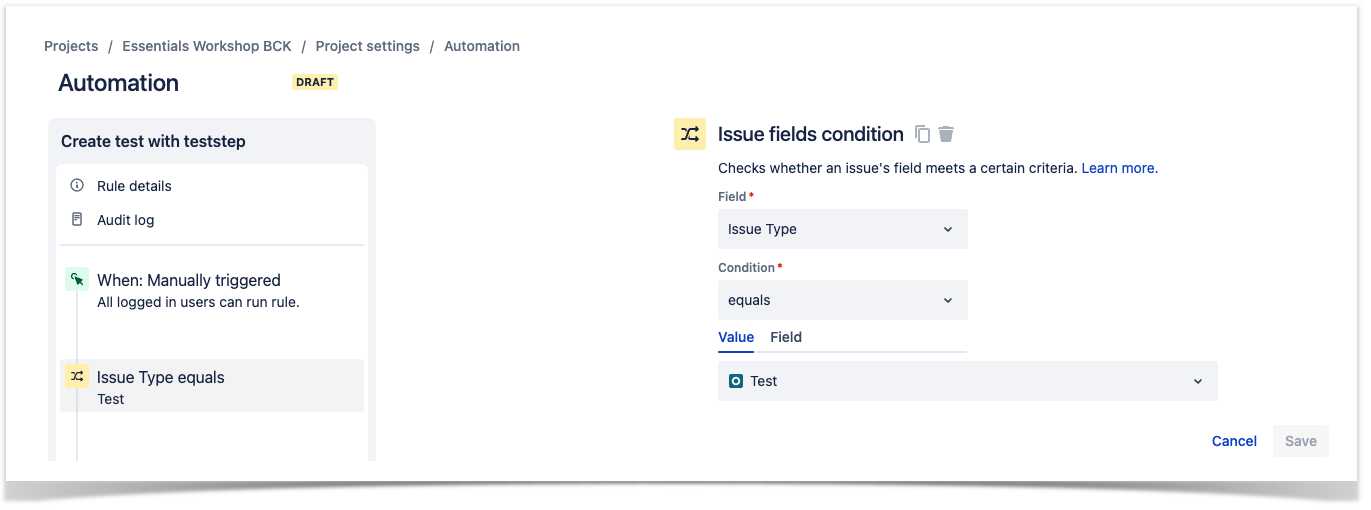
- for this example, we have added a condition so that this automation can only be triggered by Jira issues of the type: Test.
- The next component to be added is a of type: "Send web request" where we will perform the authentication with the Xray API.
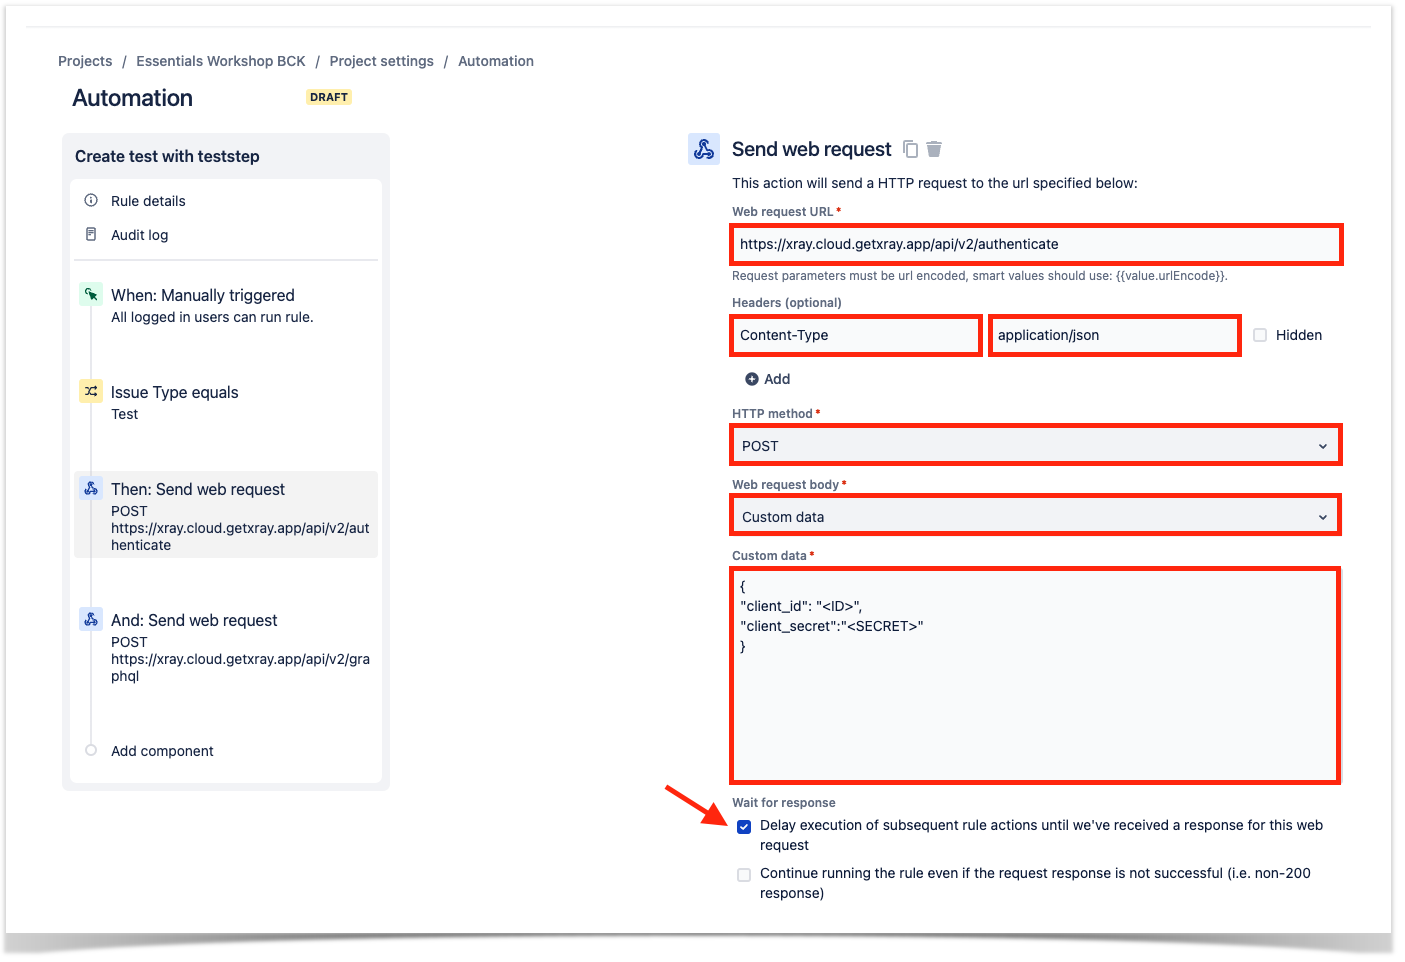
- Make sure to fill the fields with correct information:
- Web request URL: Authentication URL of Xray API.
- Headers: Add the "Content-Type" header with the value: "application/json".
- Define the HTTP method as POST.
- Choose the "Custom data" as the Web request body.
- Add the Json request as seen in the picture with a valid client_id and client_secret (obtained in your Jira instance).
- Tick the "delay execution..." option at the bottom as we want to use the token generated in this request in the next ones.
- Make sure to fill the fields with correct information:
- Next add another "Send web request" component to make the GraphQL request.
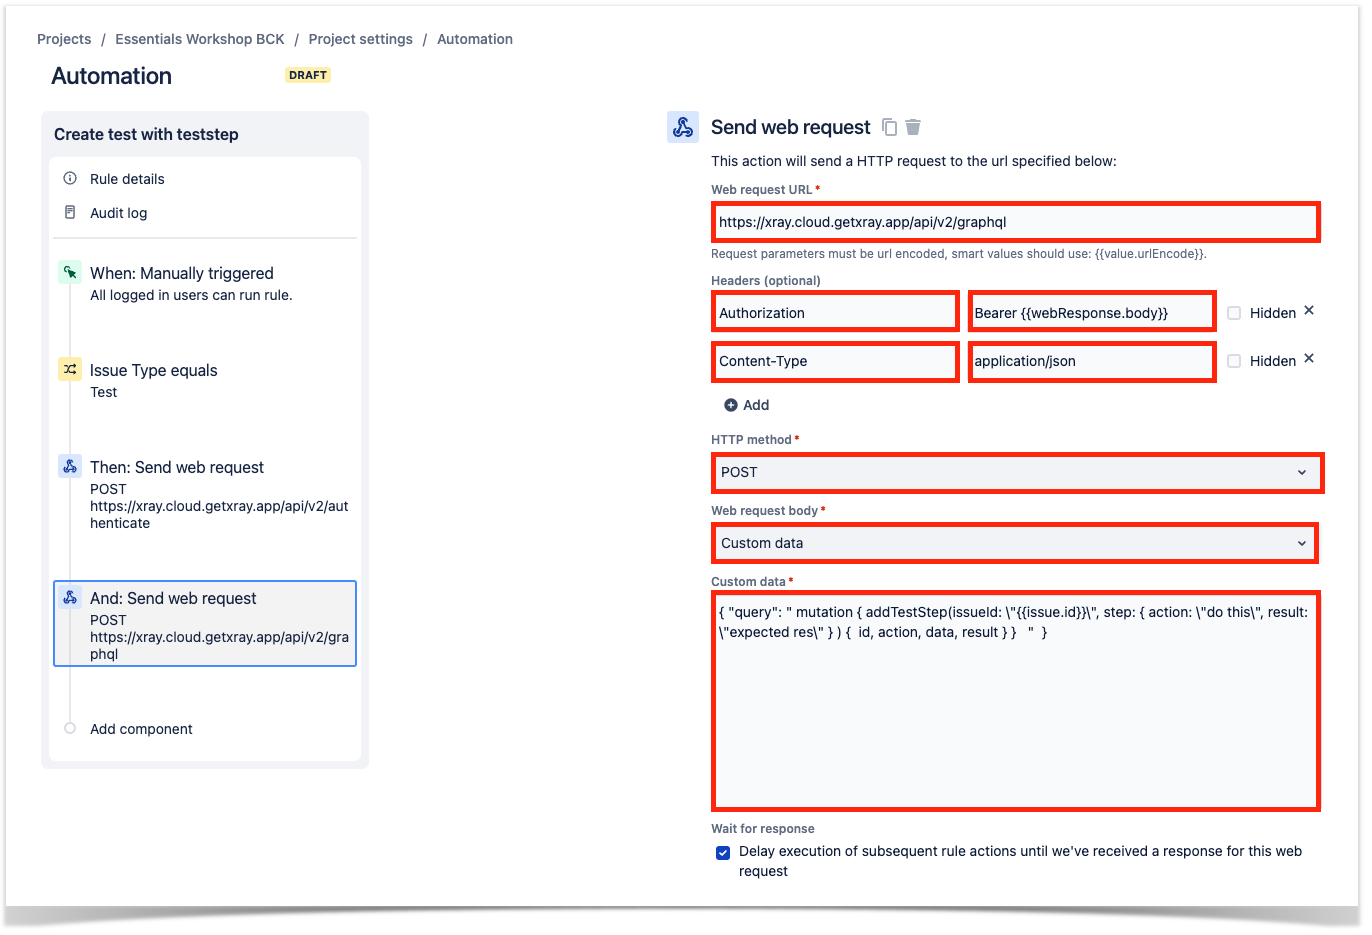
- Make sure to fill the fields with correct information:
- Web request URL with the endpoint of the Xray graphQL.
- Add two headers:
- "Content-Type" with "application/json".
- "Authorization" with "Bearer <token>". Notice that we are using a special way to get the token {{webResponse.body}} provided by Jira automation, this will get the value from the last web request made and fetch the body of the answer.
- Define the HTTP method as POST.
- Choose the Web request body to be Custom data.
- Fill the Custom data with a proper formatted graphQL request as seen in the picture (make sure the format is correct or the request will fail).
- Make sure to fill the fields with correct information:
Usage
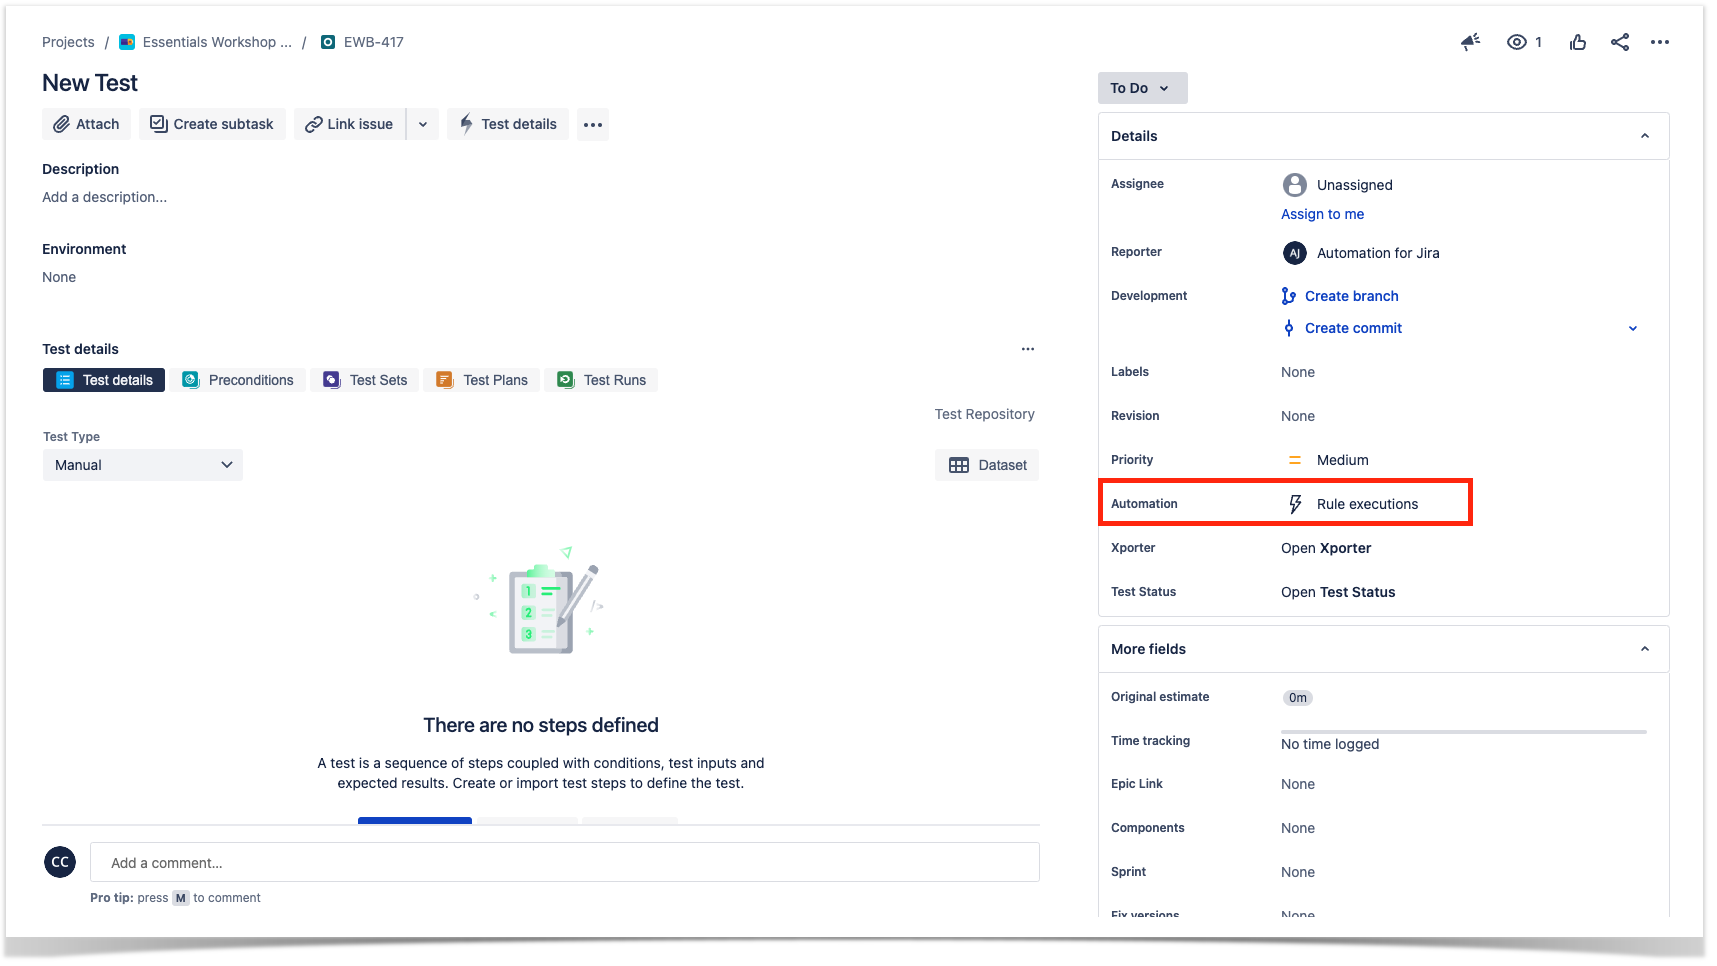
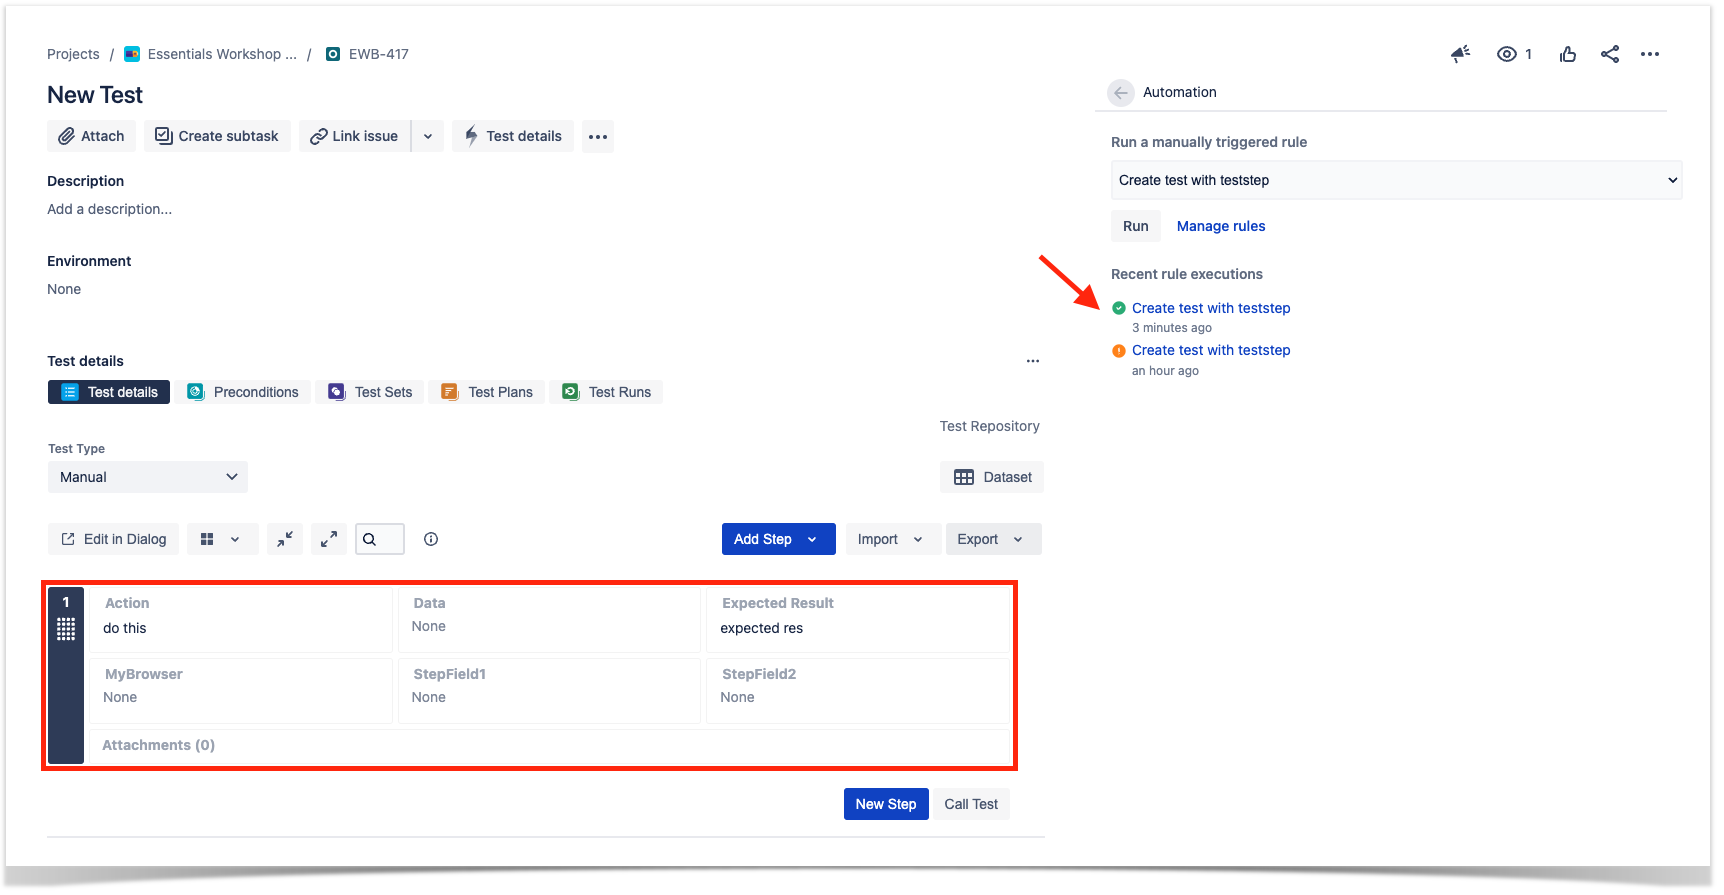
Once the automation is defined we can access it in the test detail view of a Test in Jira. On the right side you have an entry called "Automation".
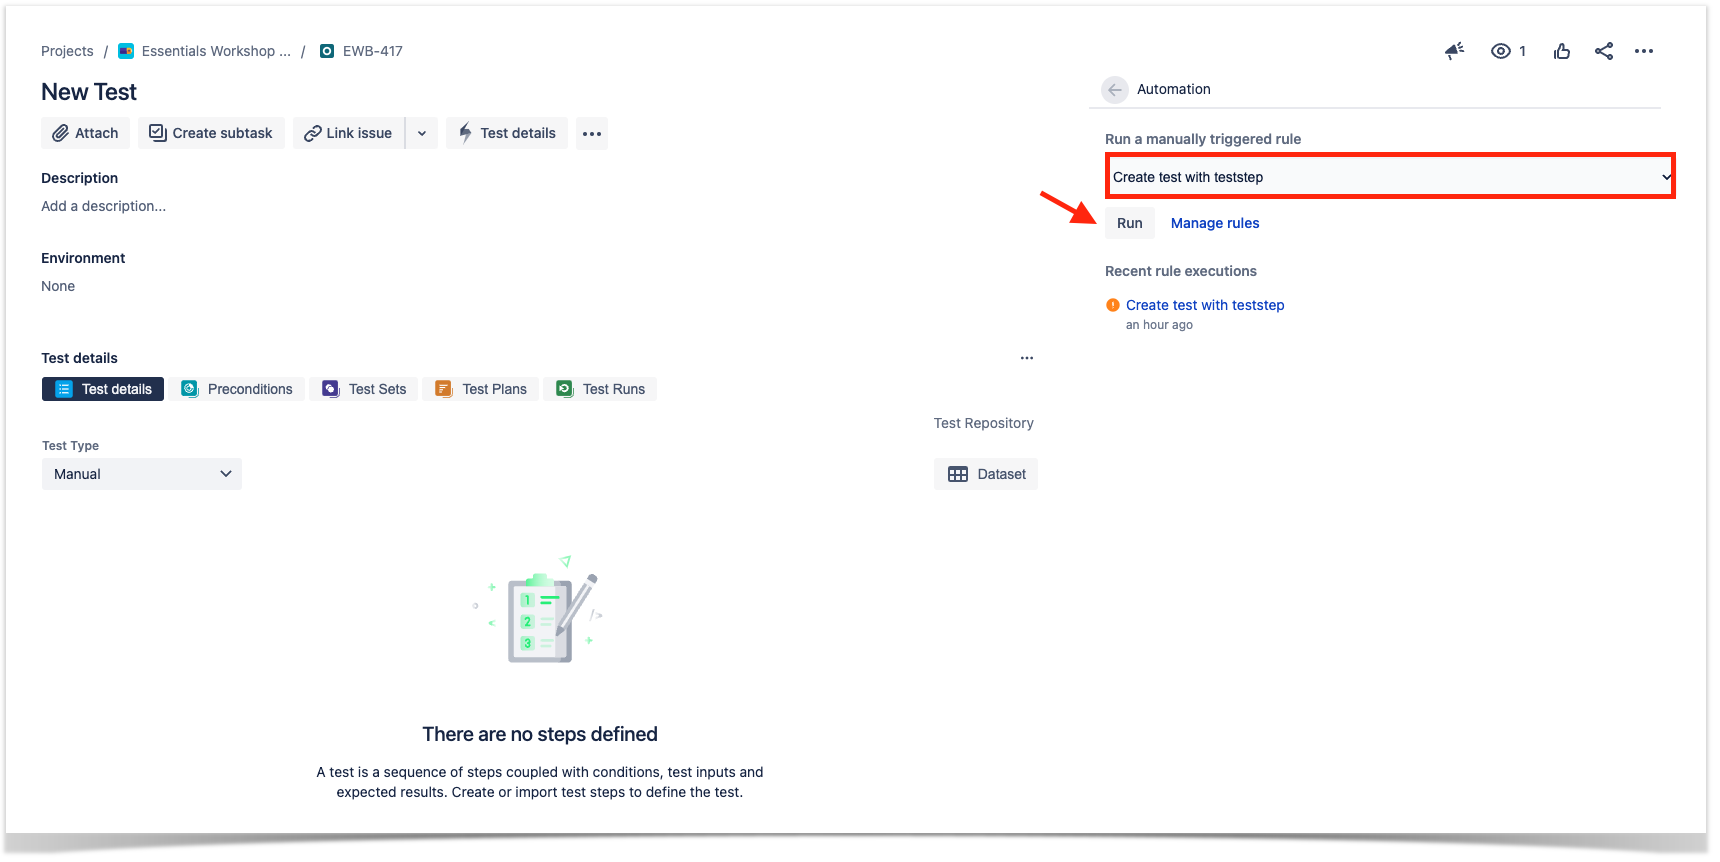
After clicking on it another screen will load with all the automation rules defined and the possibility to run each of them. Once you choose the correct rule and press "Run" the rule will be executed.
The status of the execution is showed in the section "Recent rule executions".
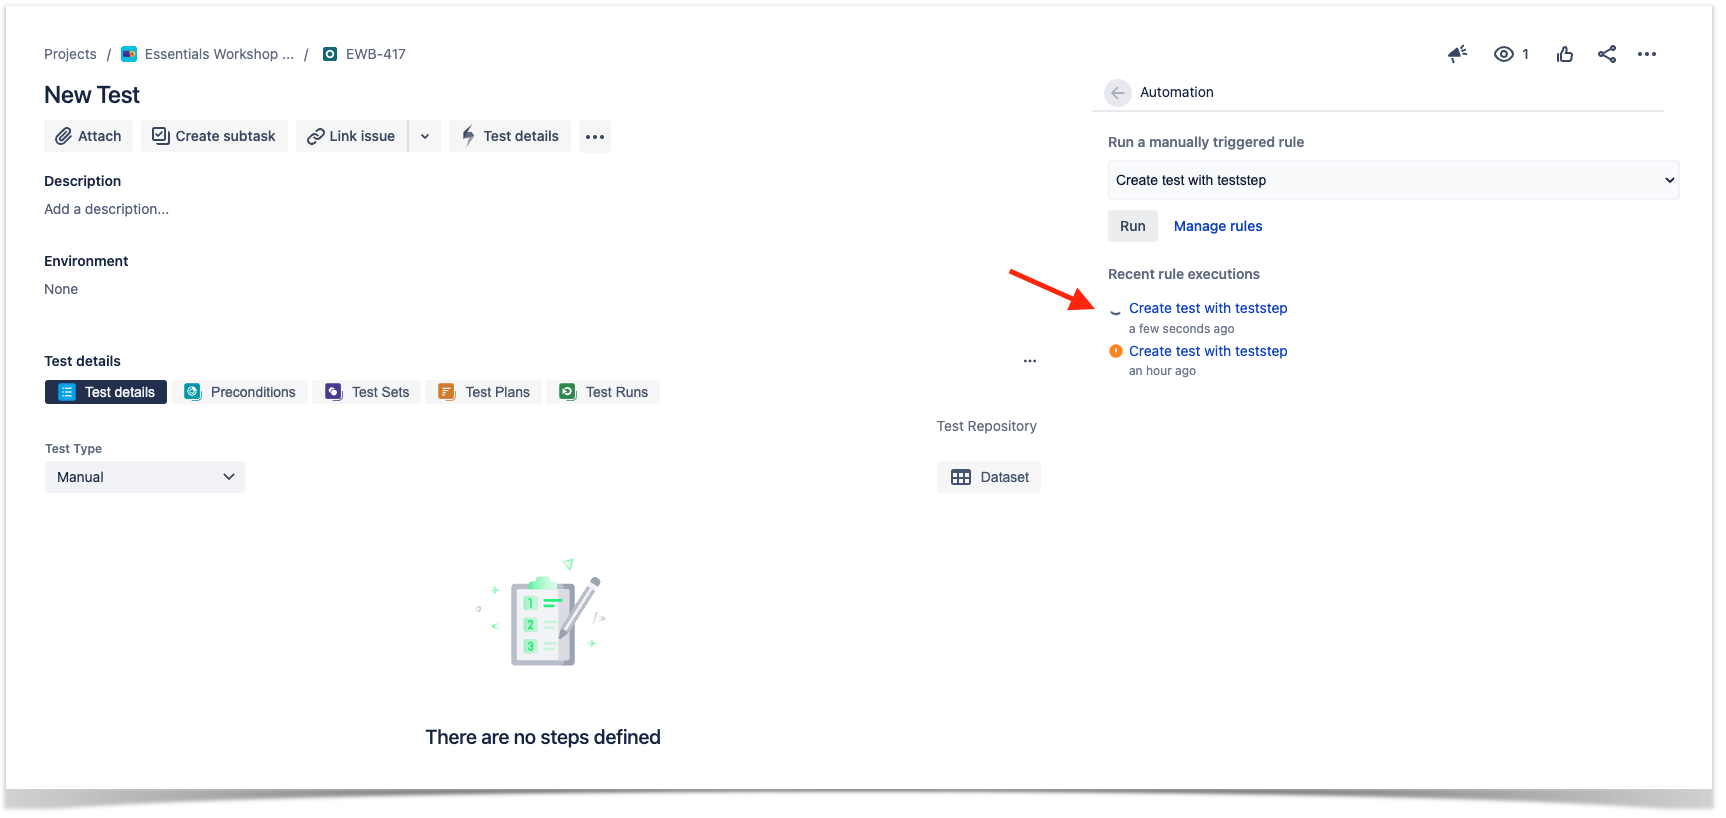
When the automation rule is executed with success a new test step will be added to the Test as we can see below.
Tips
Accessing network-restricted CI/CD tools
If your target system is behind a firewall or it's a local IP address, you can use ngrok tool to create a temporary tunnel to it. Please check with your IT/security team(s).
Accessing audit log of Jira automation
If you wan to have more information about the rule execution you can click over the link presented in the "Recent rules executions".
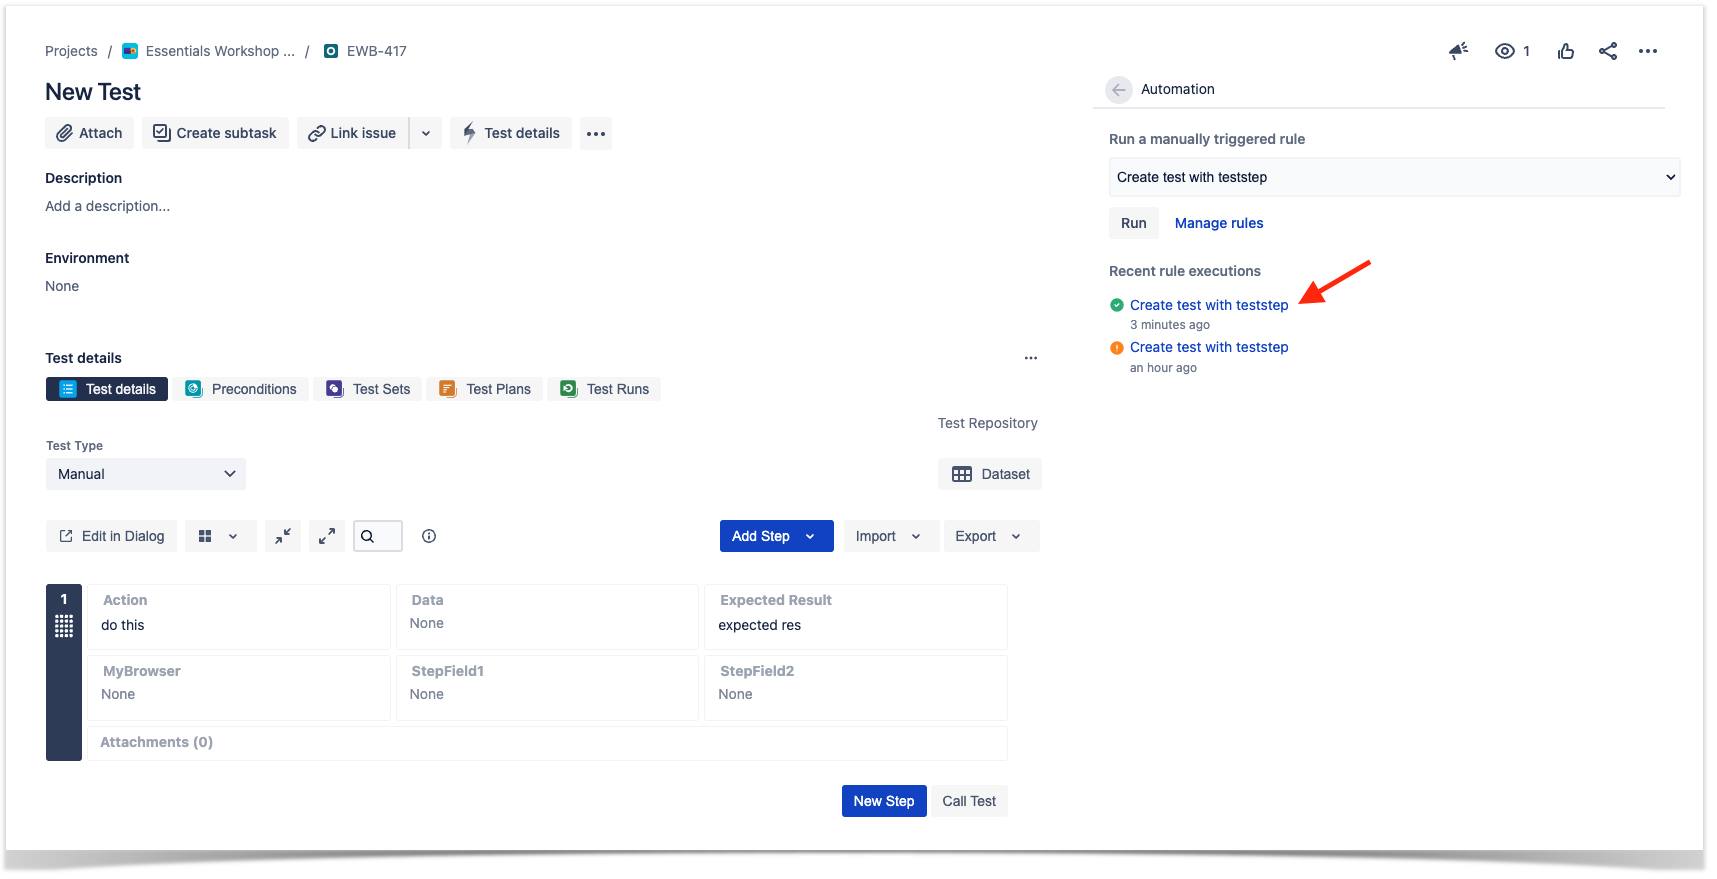
This will take us to the Automation rule details page where we can access the Audit log of that rule.
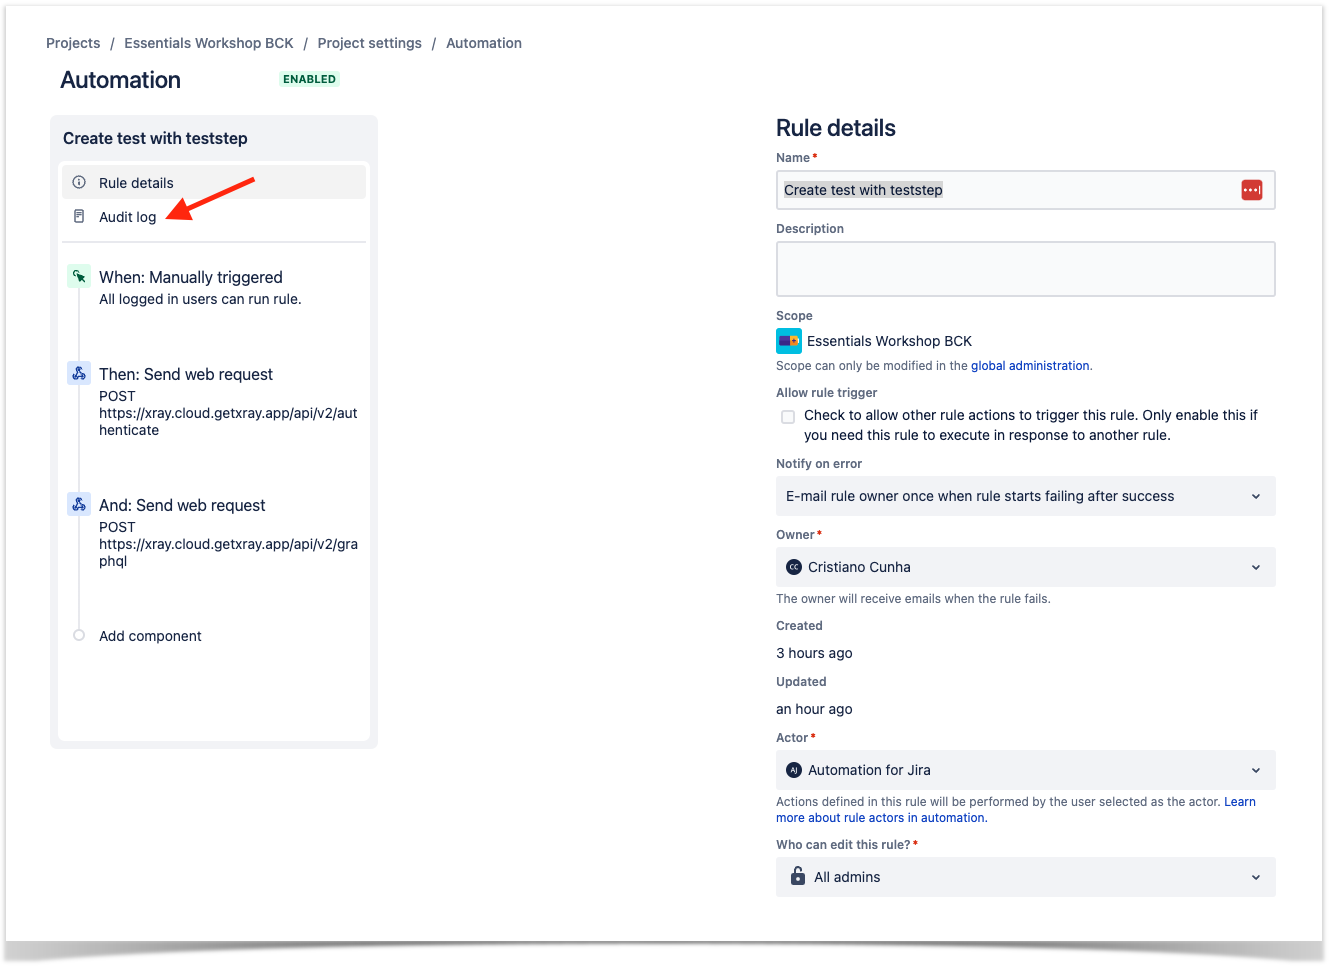
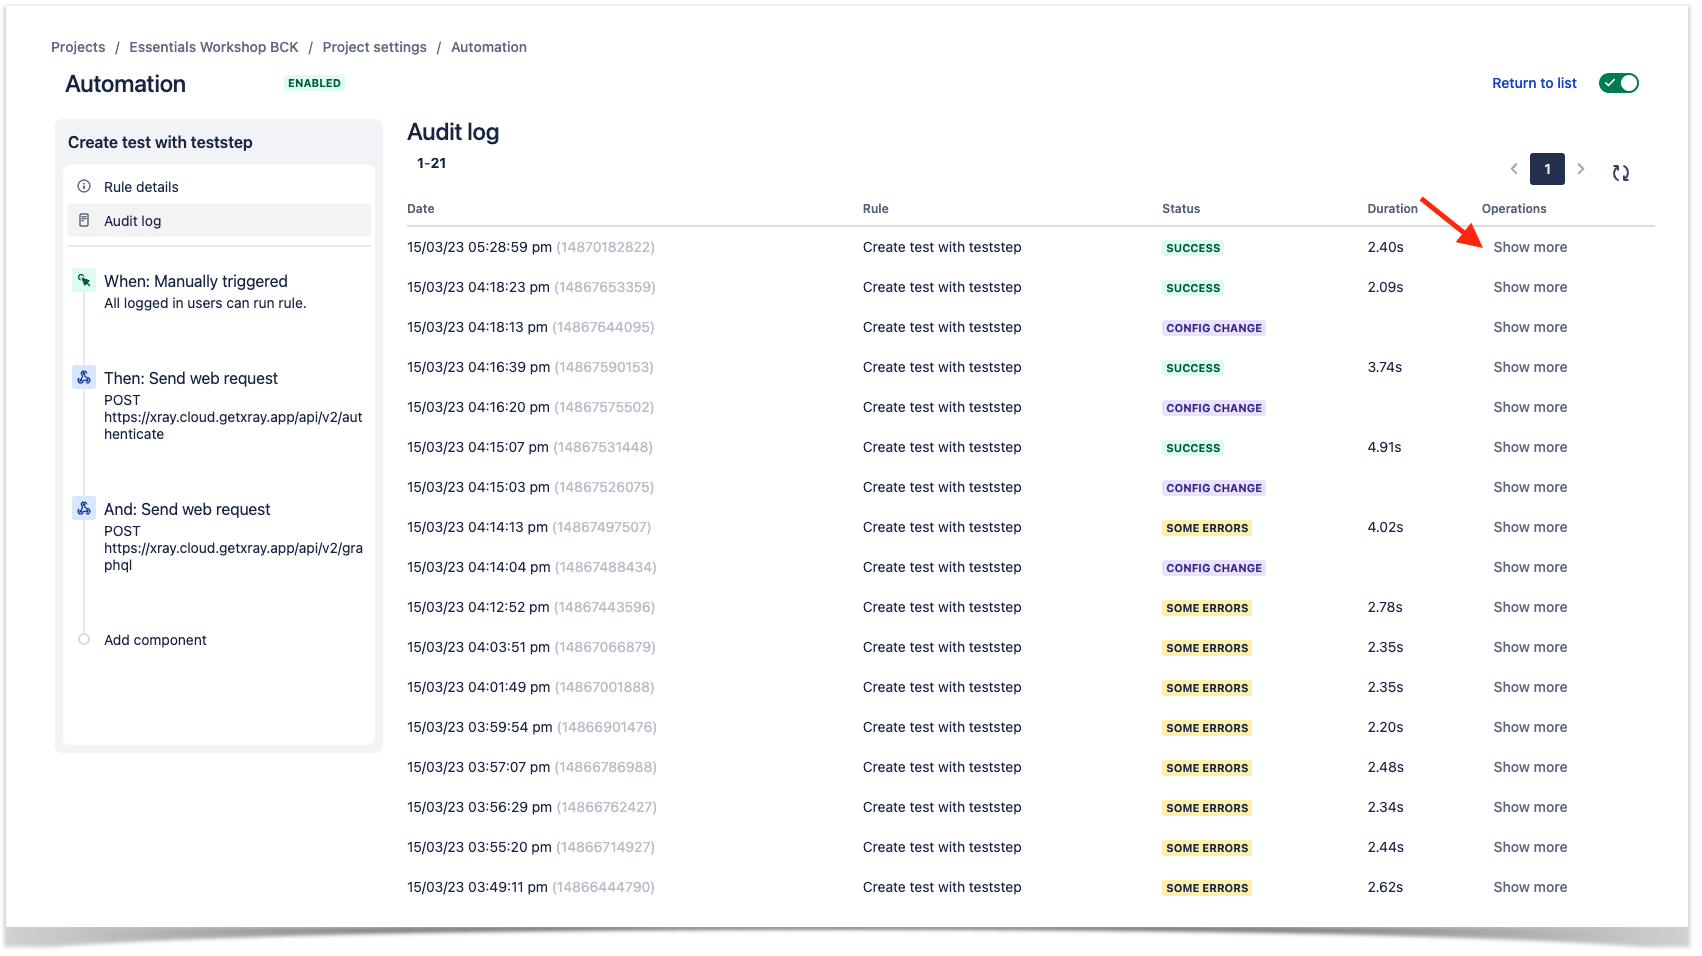
This option will load all the actions performed over the rule and we can have some more details if we press the "Show more" option.
References
- Automation for Jira documentation
- Bitbucket Cloud
- GitHub
- GitLab
- Azure DevOps