
Page History
Calculates the test coverage status for a list of coverable issues, in a normalised horizontal stacked bar chart, for the selected version or Test Plan, and/or Test Environment. Evaluate the completeness of each issue.Table of Contents
| Note | ||
|---|---|---|
| ||
To use this report, you must have some configured Issue Types configured as coverable issue types, in the project settings. More info in Project Settings: Test Coverage |
...
The Test Coverage report provides the means to analyze your requirements statuses in real-time.
| Table of Contents |
|---|
How to use
This report is accessible either from the Xray icon on the left sidebar of the project or from the standard Reports icon, which includes other kind of reports besides Xray. You need to configure
At the top of the report, you have some options that need to be configured.
- Analysis & Scope: dd
- Group By: how to visually group the coverable issues (e.g. by prioriy, by component)
- View: flat ot hierarchical
- Filters: the source data for the report (e.g. the requirements or other covered issues) and how to evaluate the status for each one of the item being shown.
Source data
The source data for the report (e.g. the requirements or other covered issues) can be defined under "Filters", available at the top-right side corner.
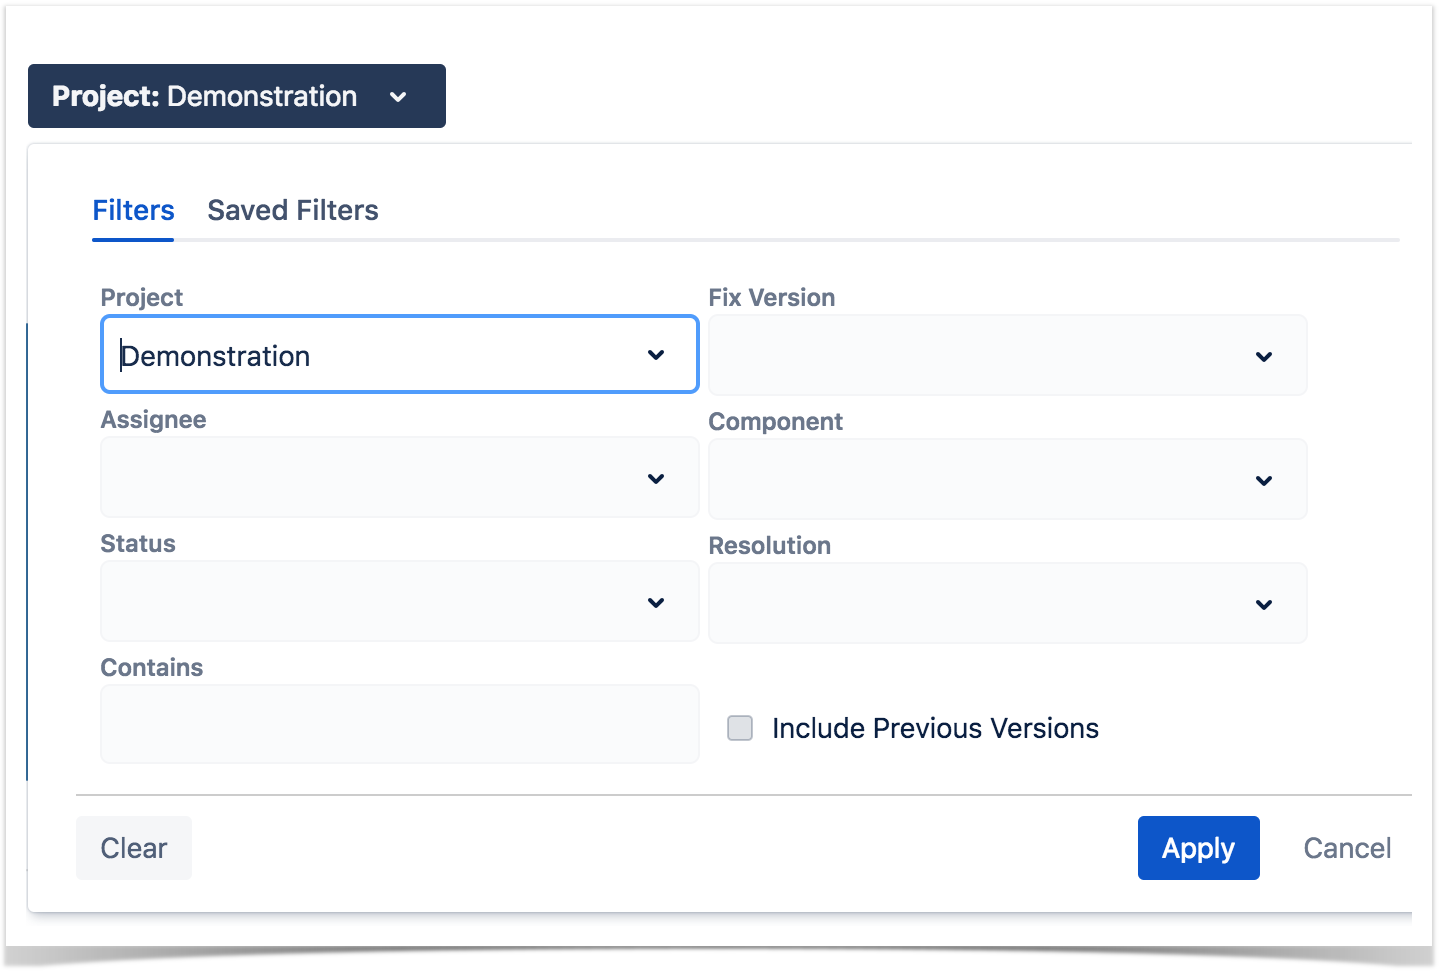
Source "requirement"/covereable issues can be directly provided using a saved filter or by specific requirement fields:
- Saved filter: a saved filter containing requirement/coverable issues
- Project: project
- Fix Version: version assigned to the requirement issue (you can also choose whether to include the previous versions - equivalent in JQL to fixVersion <= X. The default value for this option can be changed in the Xray configuration.)
- Assignee: the requirementissue's assignee
- Component: the component assigned to requirementthe issue
- Status: the workflow status
- Resolution: the workflow resoluton
- Contains: the requirement's th issue key or summary
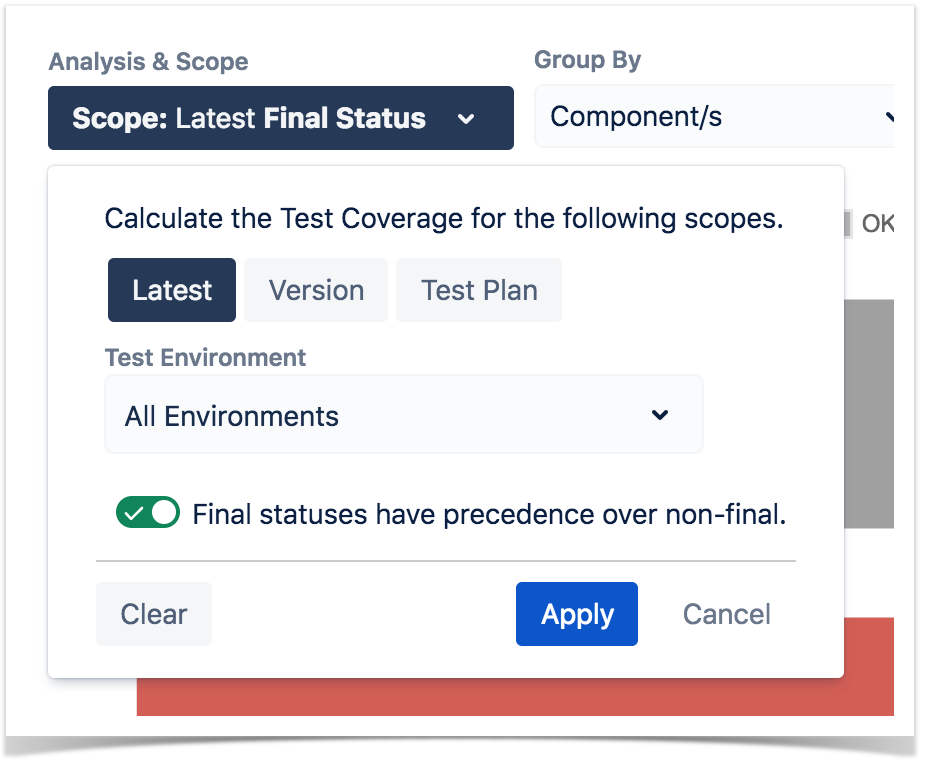
Analysis & Scope
...
If you specify the Test Environment, then only the executions that ran in the specified environment are considered.
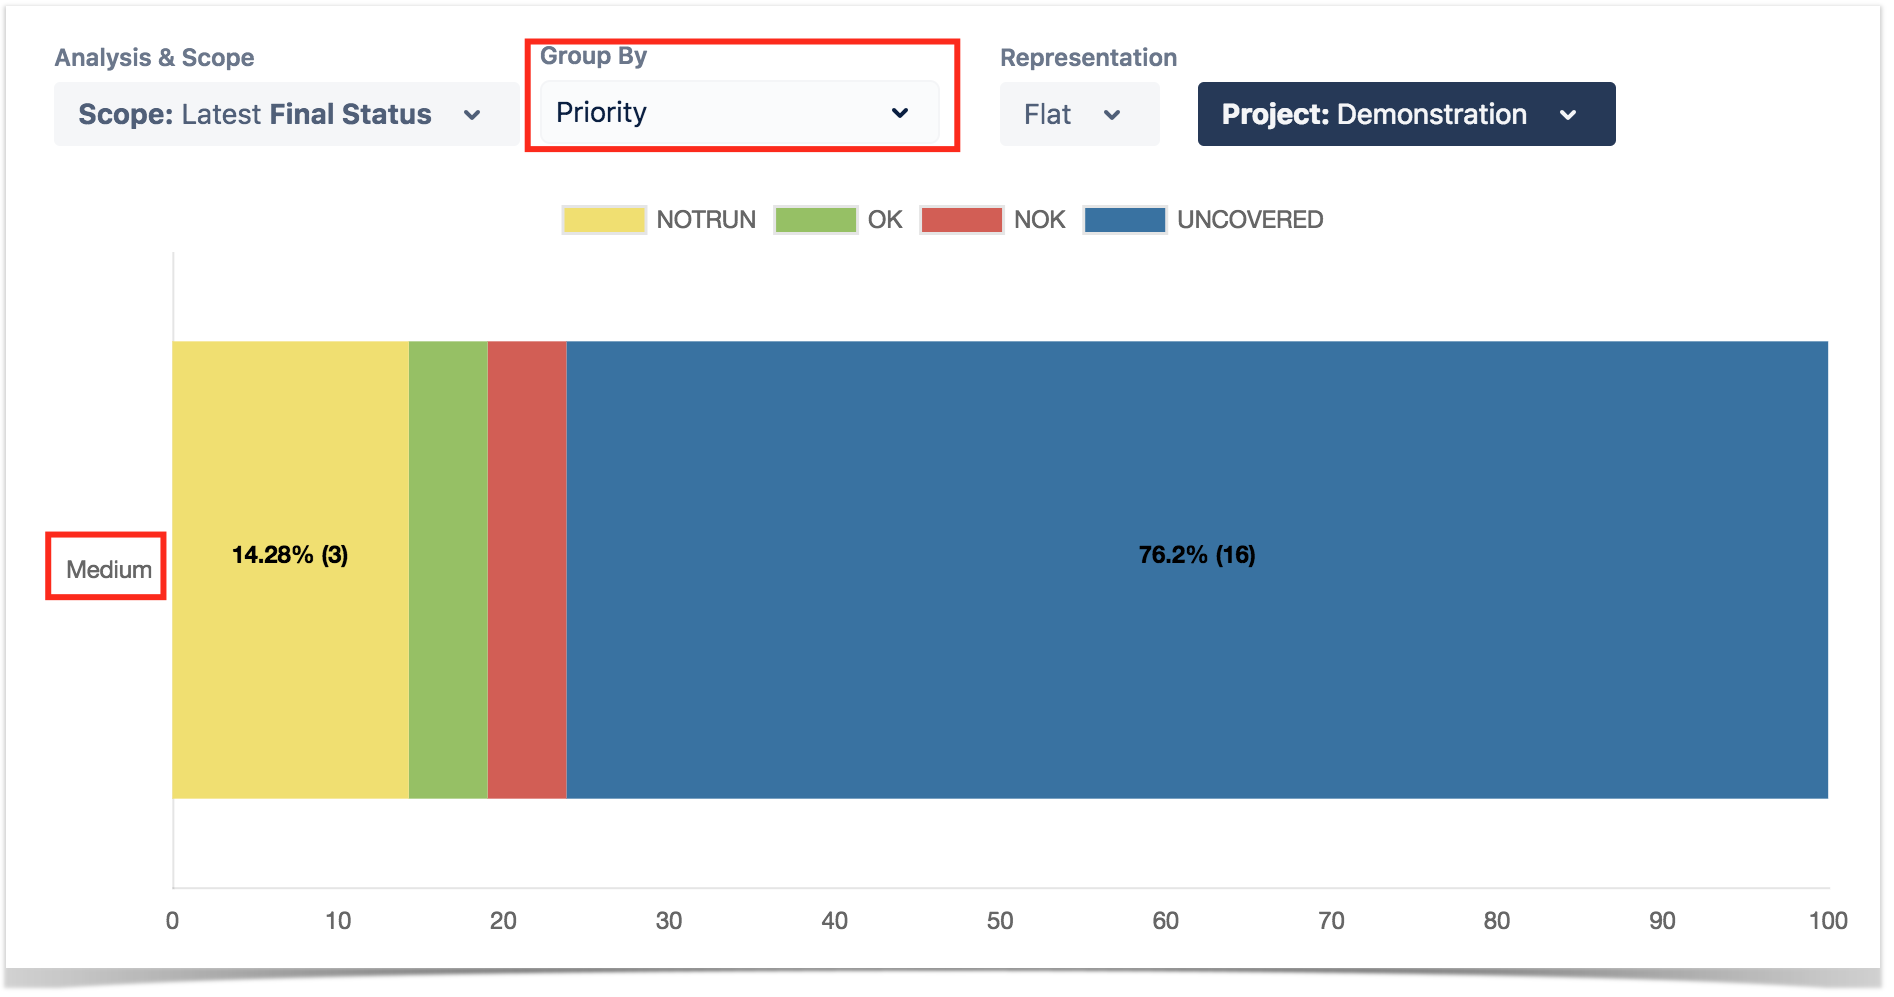
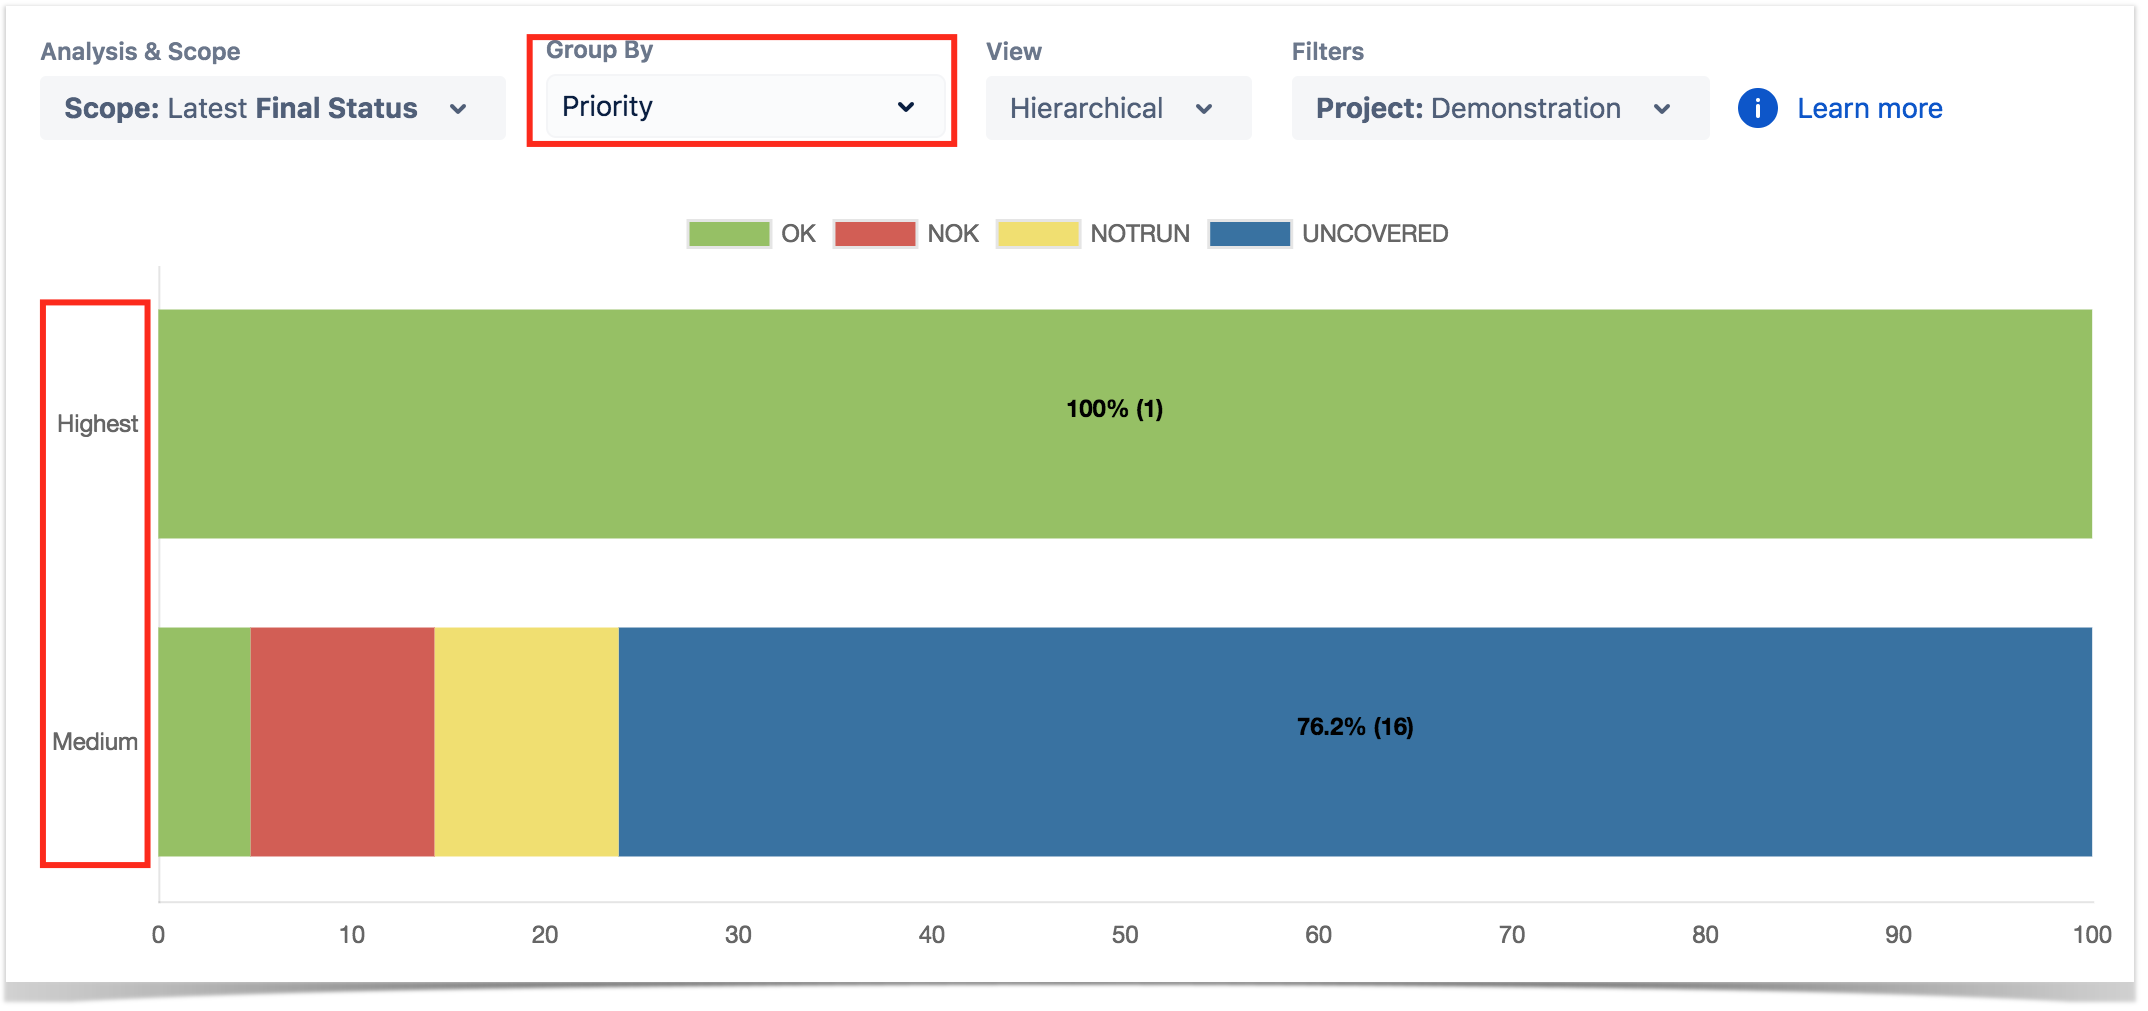
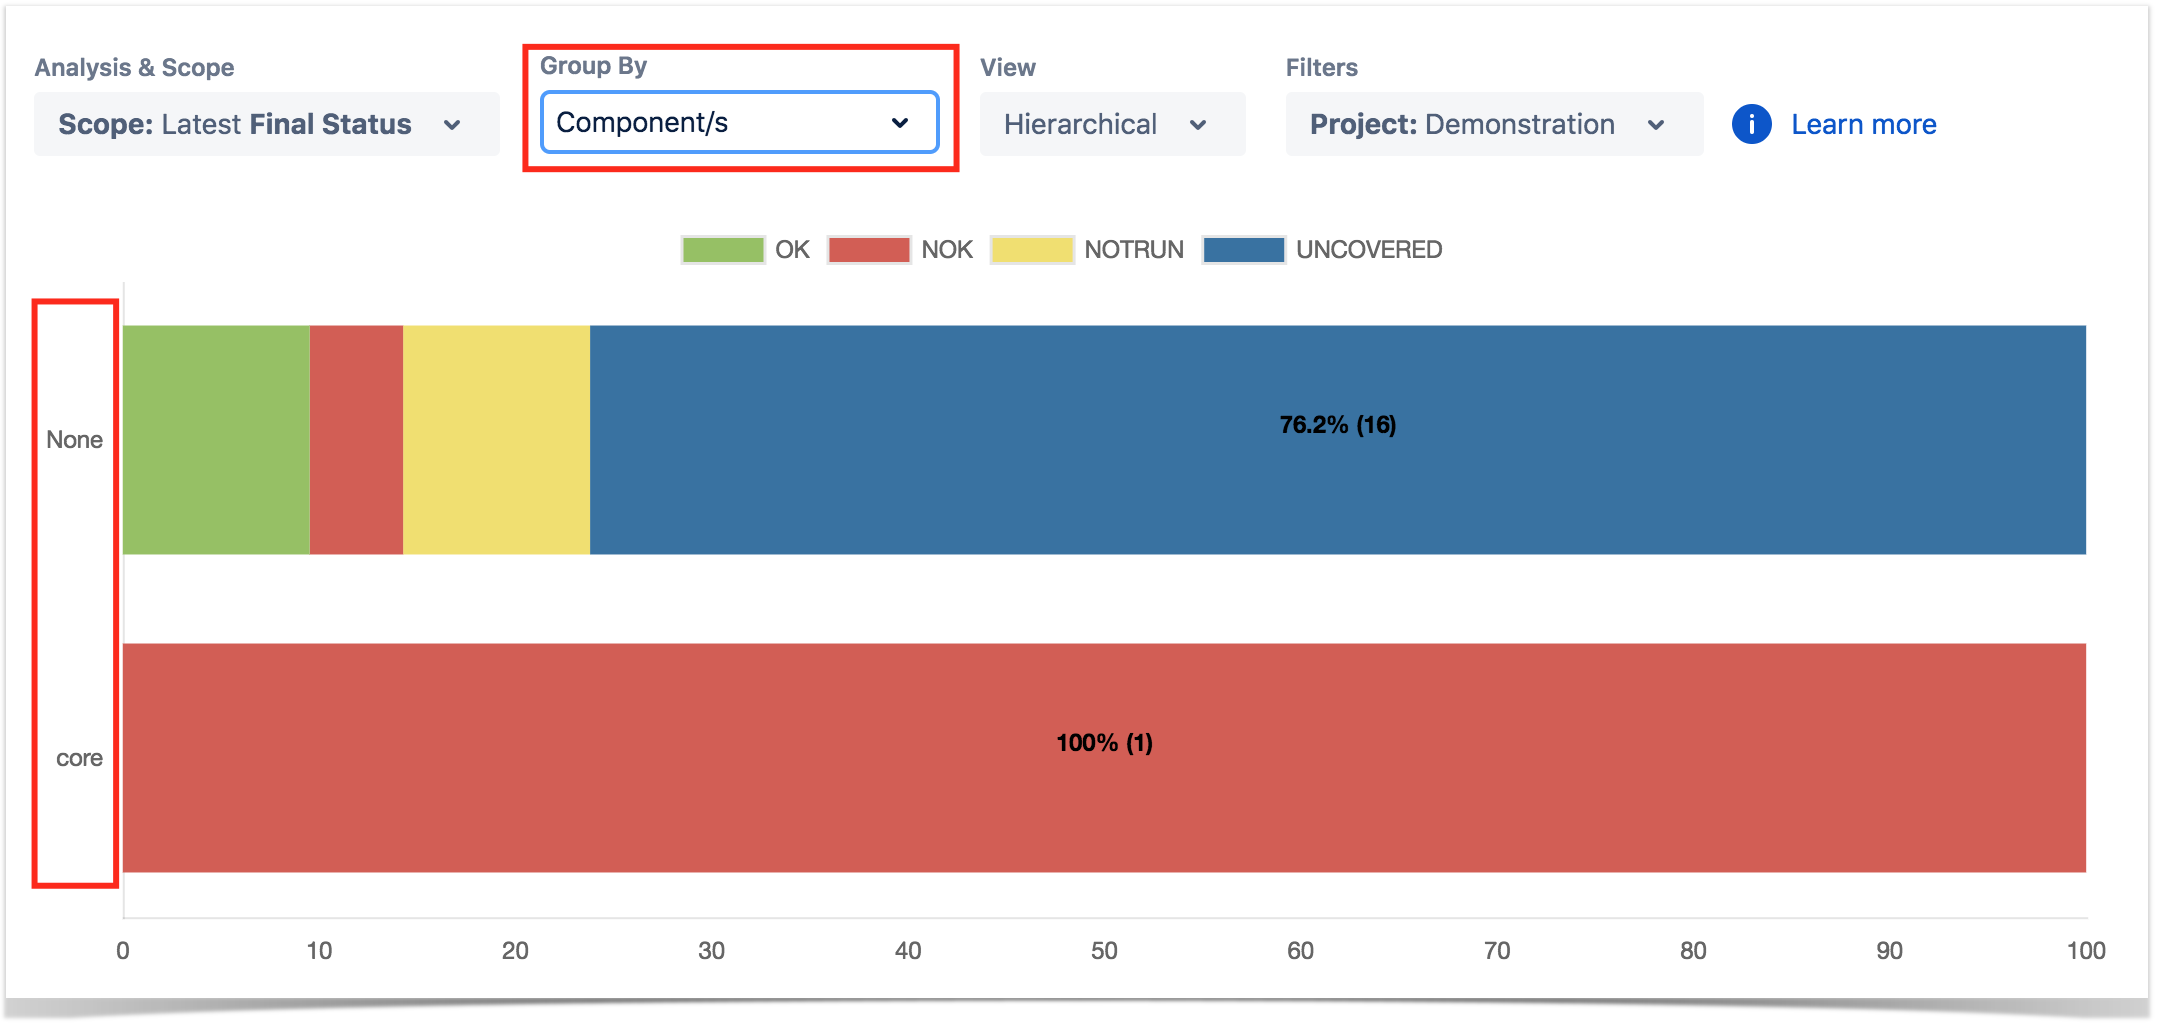
Group By
You can visually group the requirements by Priority, Component or other fields, so you can analyze requirements from different perspectives.
| Section | ||||
|---|---|---|---|---|
|

| Info | ||
|---|---|---|
| ||
For more information, please see the Requirements Coverage Analysis - TBD. |
View
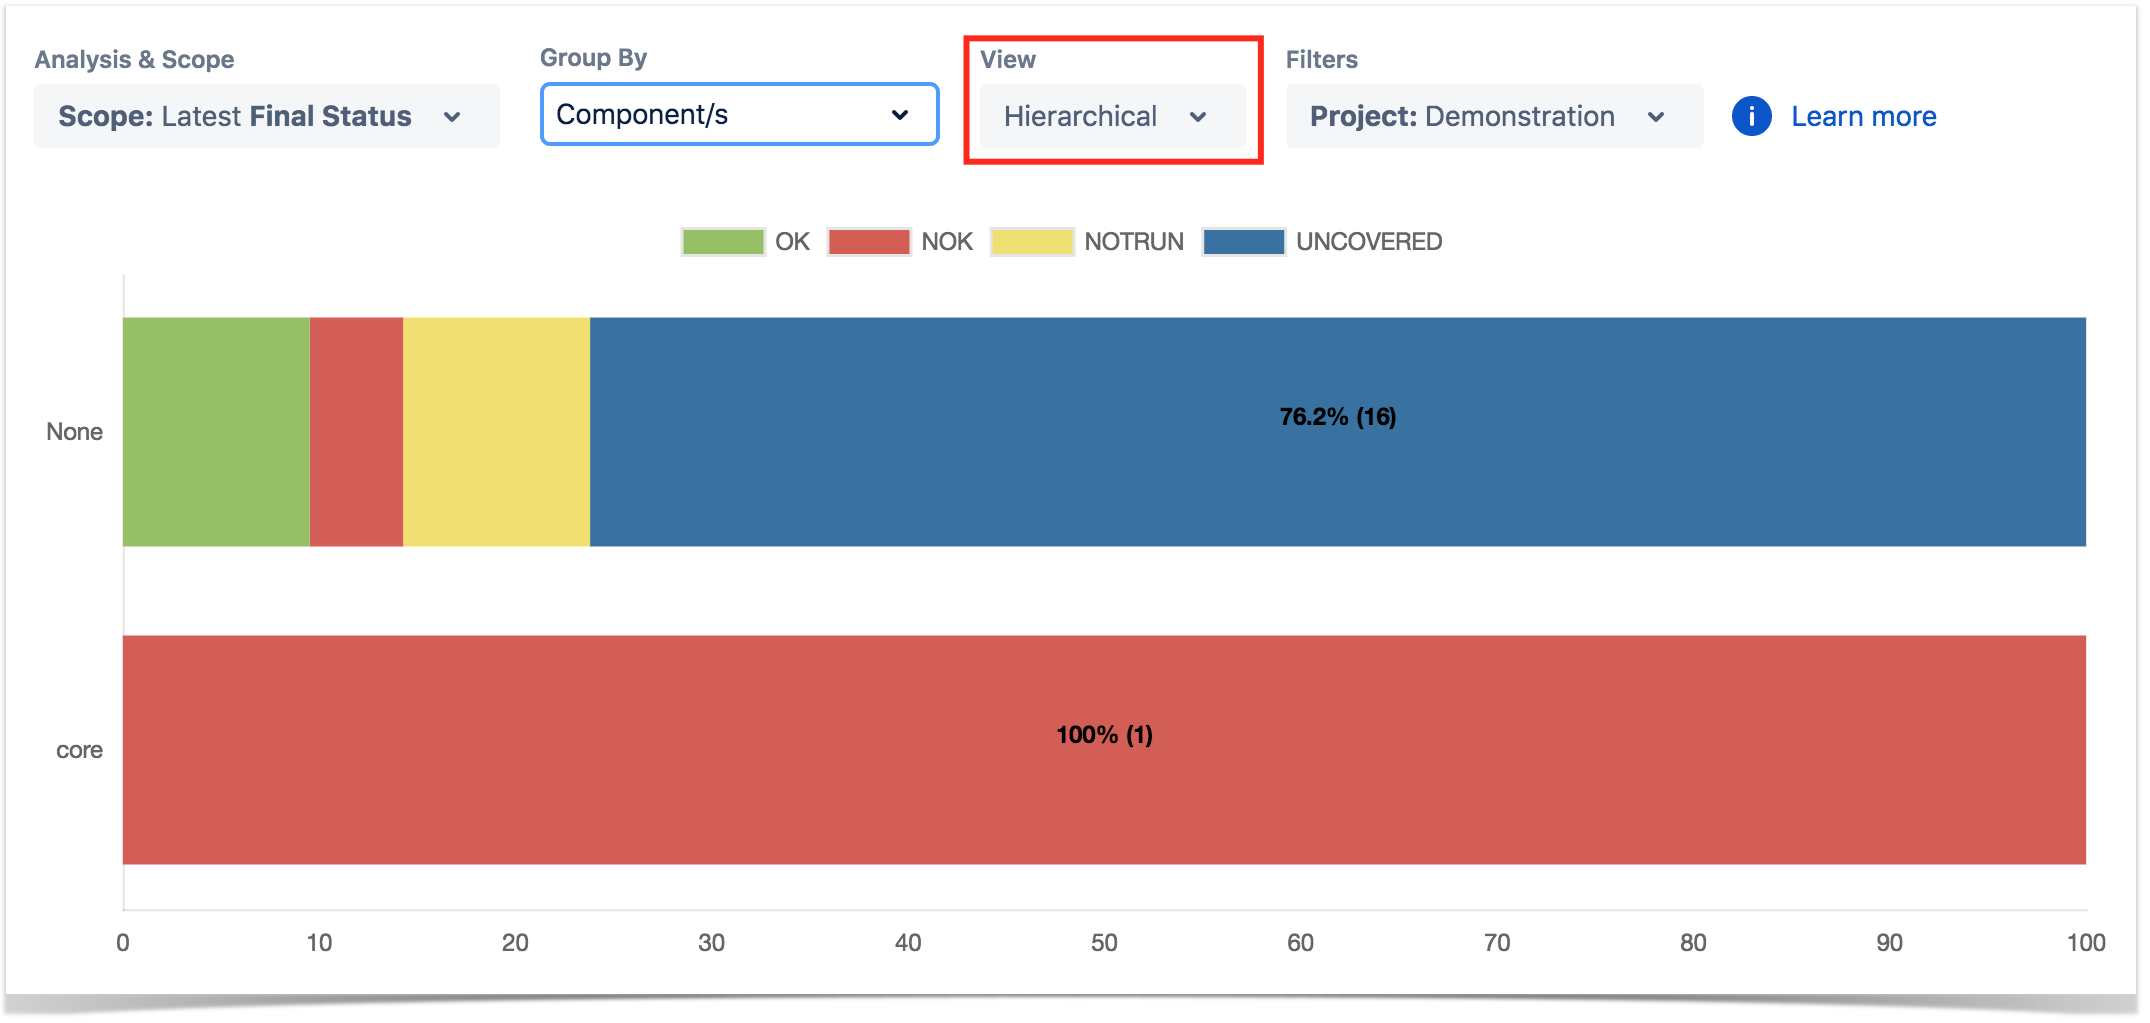
Example
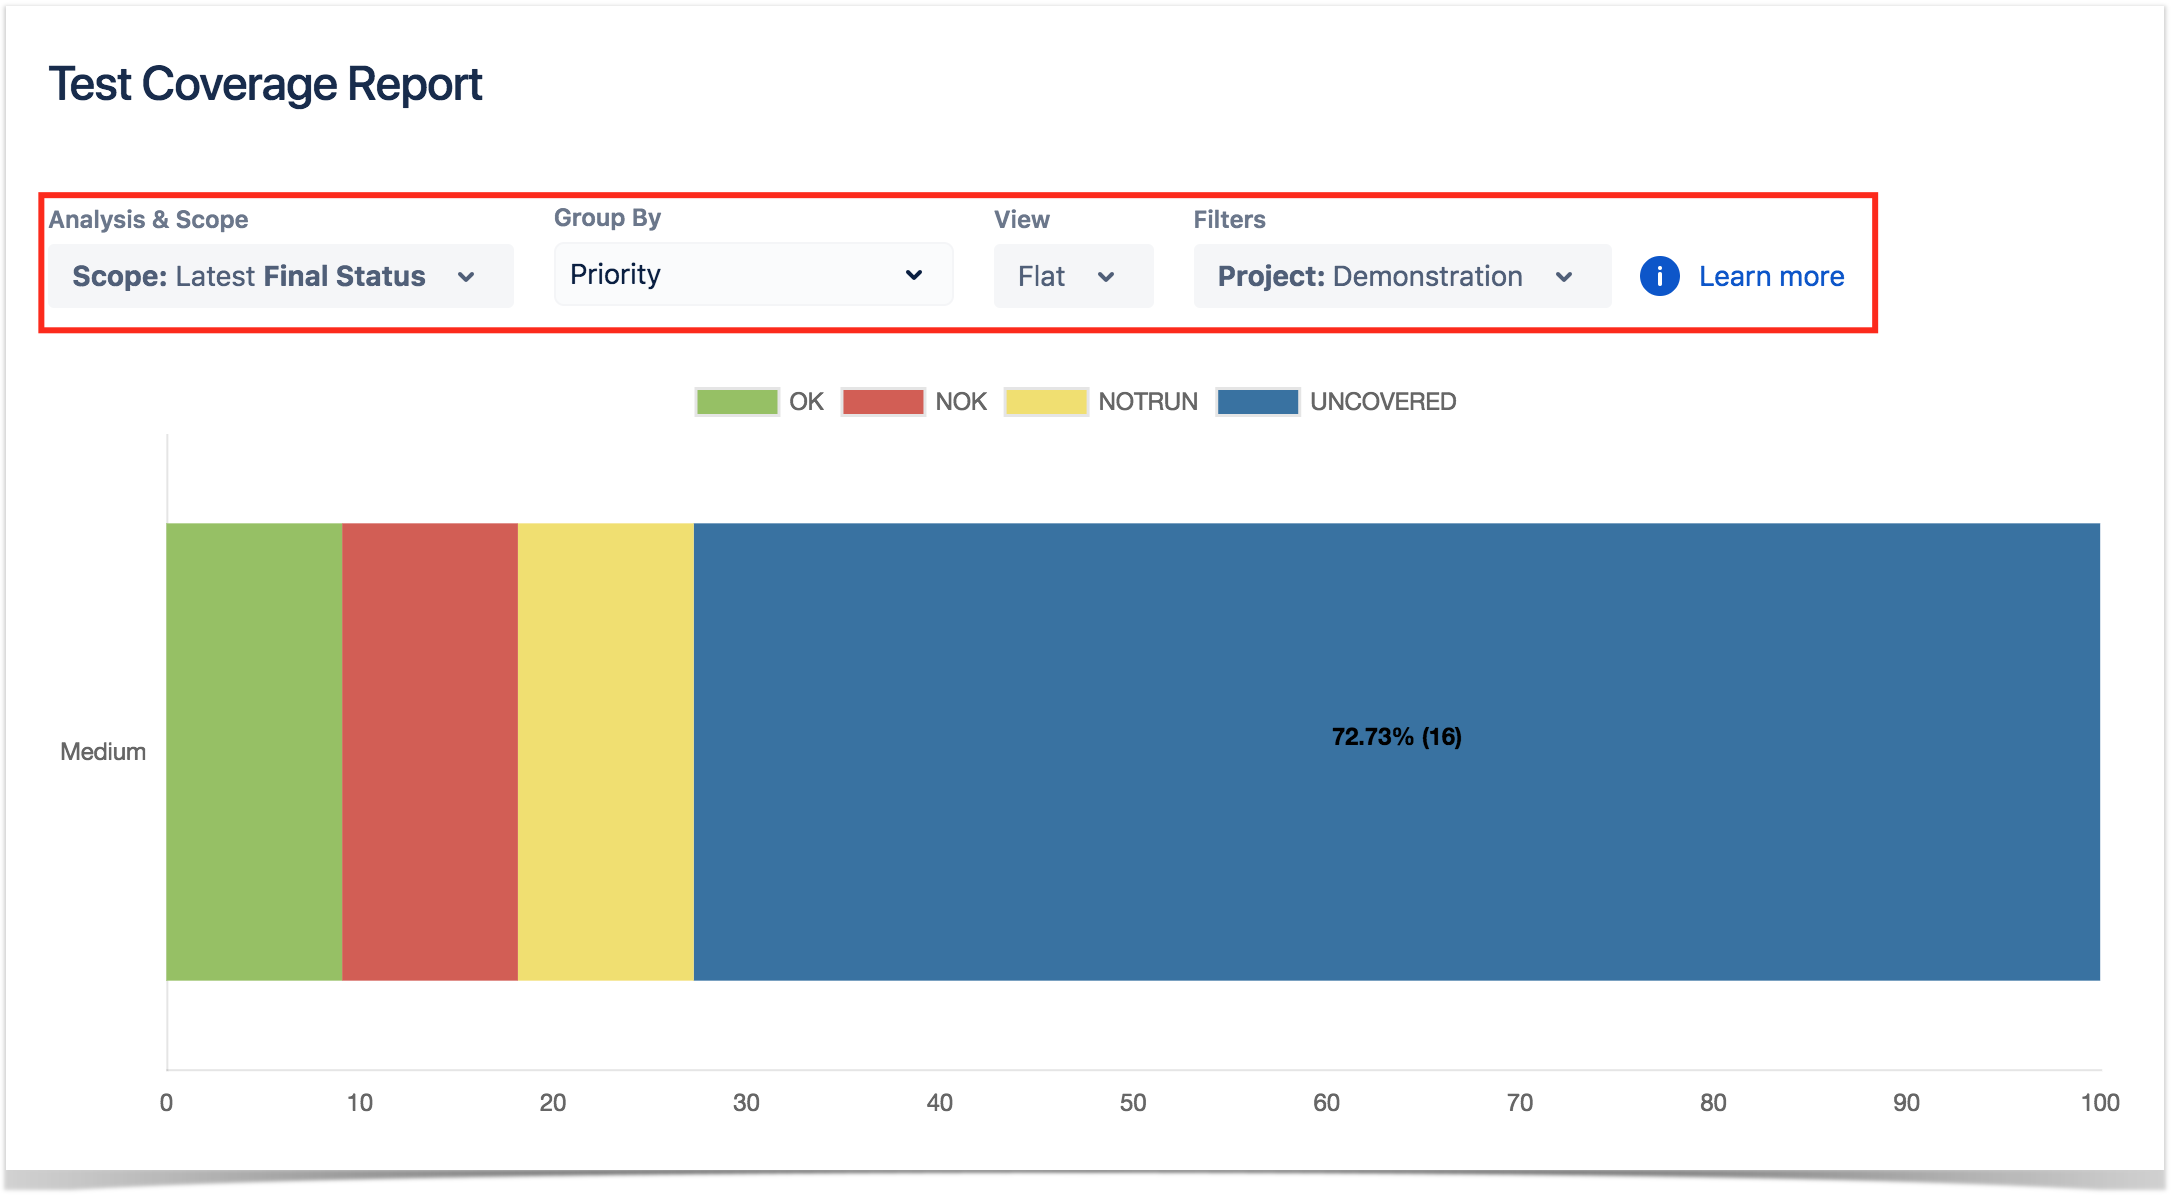
Each bar on the chart represents a group of Requirements with a different value provided by the grouping field. Stacked within each bar are the Requirements grouped by coverage status: OK, NOK, NOT RUN, UNKNOWN and UNCOVERED.
...