Page History
Calculates the test coverage status for a list of coverable issues , in a normalised horizontal stacked bar chart, for the selected version or Test Plan, and/or Test Environment. Evaluate The statuses are presented in a normalized horizontal stacked bar chart and evaluates the completeness of each issue.
...
In order to analyze the current status of your release, or even other past releases from the past, you need to evaluate the status of the requirements and other covered issues, taking into account the respective results.
...
The source data for the report (e.g., the requirements or other covered issues) can be defined under "under Filters", which available at the top left-right side hand corner.
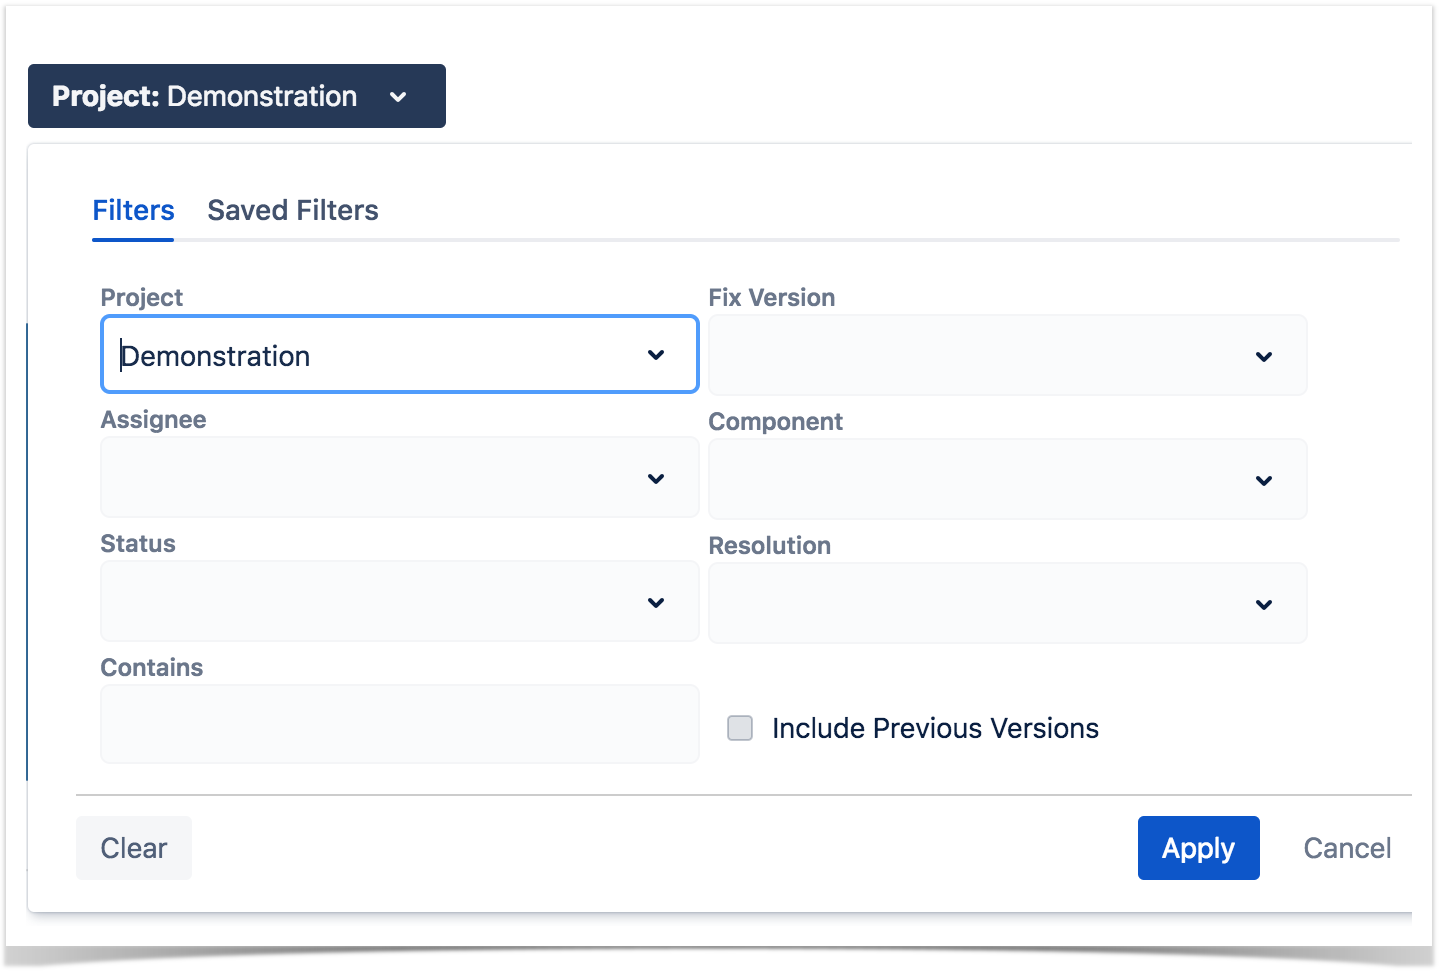
Source "requirement"/covereable coverable issues can be directly provided using a saved filter or by specific fields:
- Saved filter: a saved filter containing requirement/coverable issues
- Project: project
- Fix Version: version assigned to the issue (you can also choose whether to include the previous versions - equivalent in JQL to fixVersion <= X. The default value for this option can be changed in the Xray configuration.)
- Assignee: the issue's assignee
- Component: the component assigned to the issue
- Status: the workflow status
- Resolution: the workflow resoluton
- Contains: th issue key or summary
...
| Info | ||
|---|---|---|
| ||
Please read Coverage Analysis for a more detailed explanation on of how to perform coverage analysis. |
...
| Info | ||
|---|---|---|
| ||
For more information, please see the Coverage Analysis. |
View
In this report it's possible to You can see a flattened list of coverable issues or just the top-level ones (e.g., the top-level parent requirements).
For example, if you're using Epics and Stories , if and you choose the "Flat" view, then only the Epics will appear in the report, independently independent of whether the source data includes the sub-issues or not. In this same scenario, you had chosen If you choose the "Hierarchical" view, then only the Epics would be shown.
...
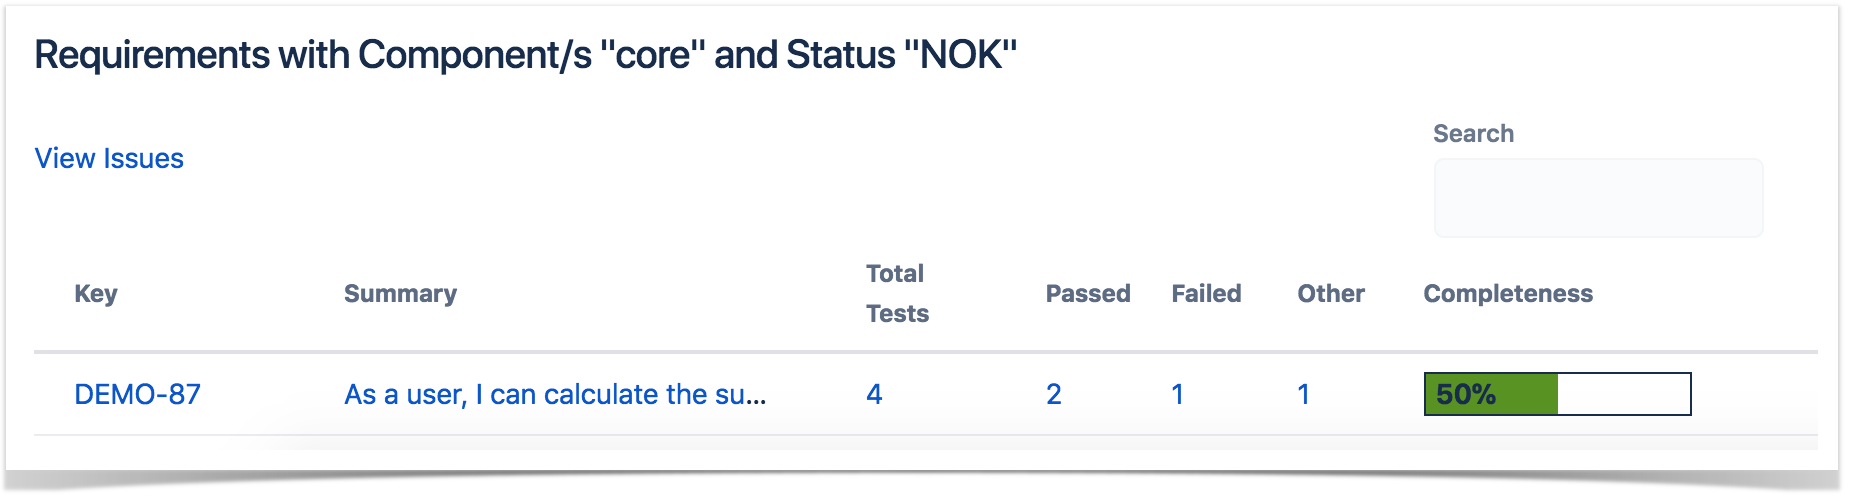
For each Requirement issue, the table shows the following indicators:
- Total Tests: total amount number of linked tests
- Passed: total amount number of tests passing (i.e., the ones whose status is mapped to the Test Coverage status "OK")
- Failed: total amount number of tests failing (i.e., the ones whose status is mapped to the Test Coverage status "NOK")
- Other: total amount number of tests whose current status is mapped to the Test Coverage statuses "Not Run" or "Unknown"
...
Some values may provide a link, so you can be redirected to the respective entities corresponding to the number shown number.