Page History
| UI Steps | ||||||||||||||||||||||||||||||||
|---|---|---|---|---|---|---|---|---|---|---|---|---|---|---|---|---|---|---|---|---|---|---|---|---|---|---|---|---|---|---|---|---|
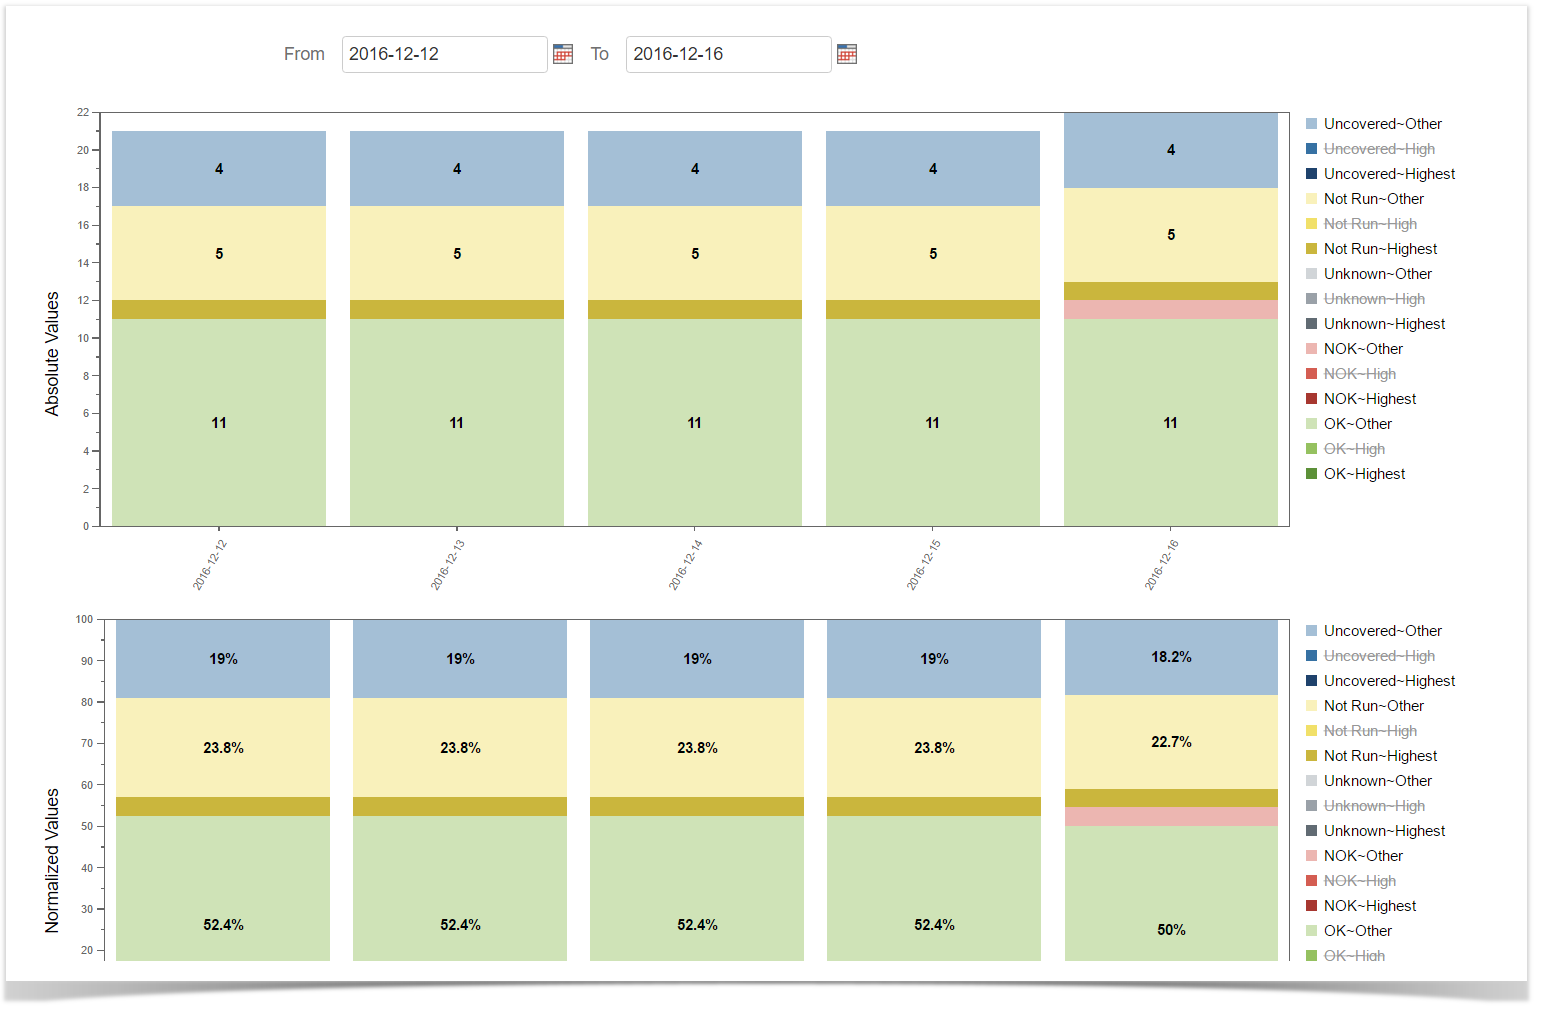
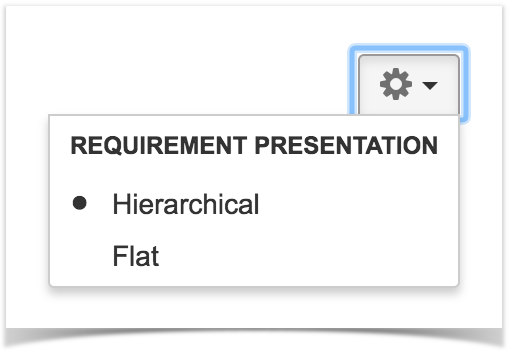
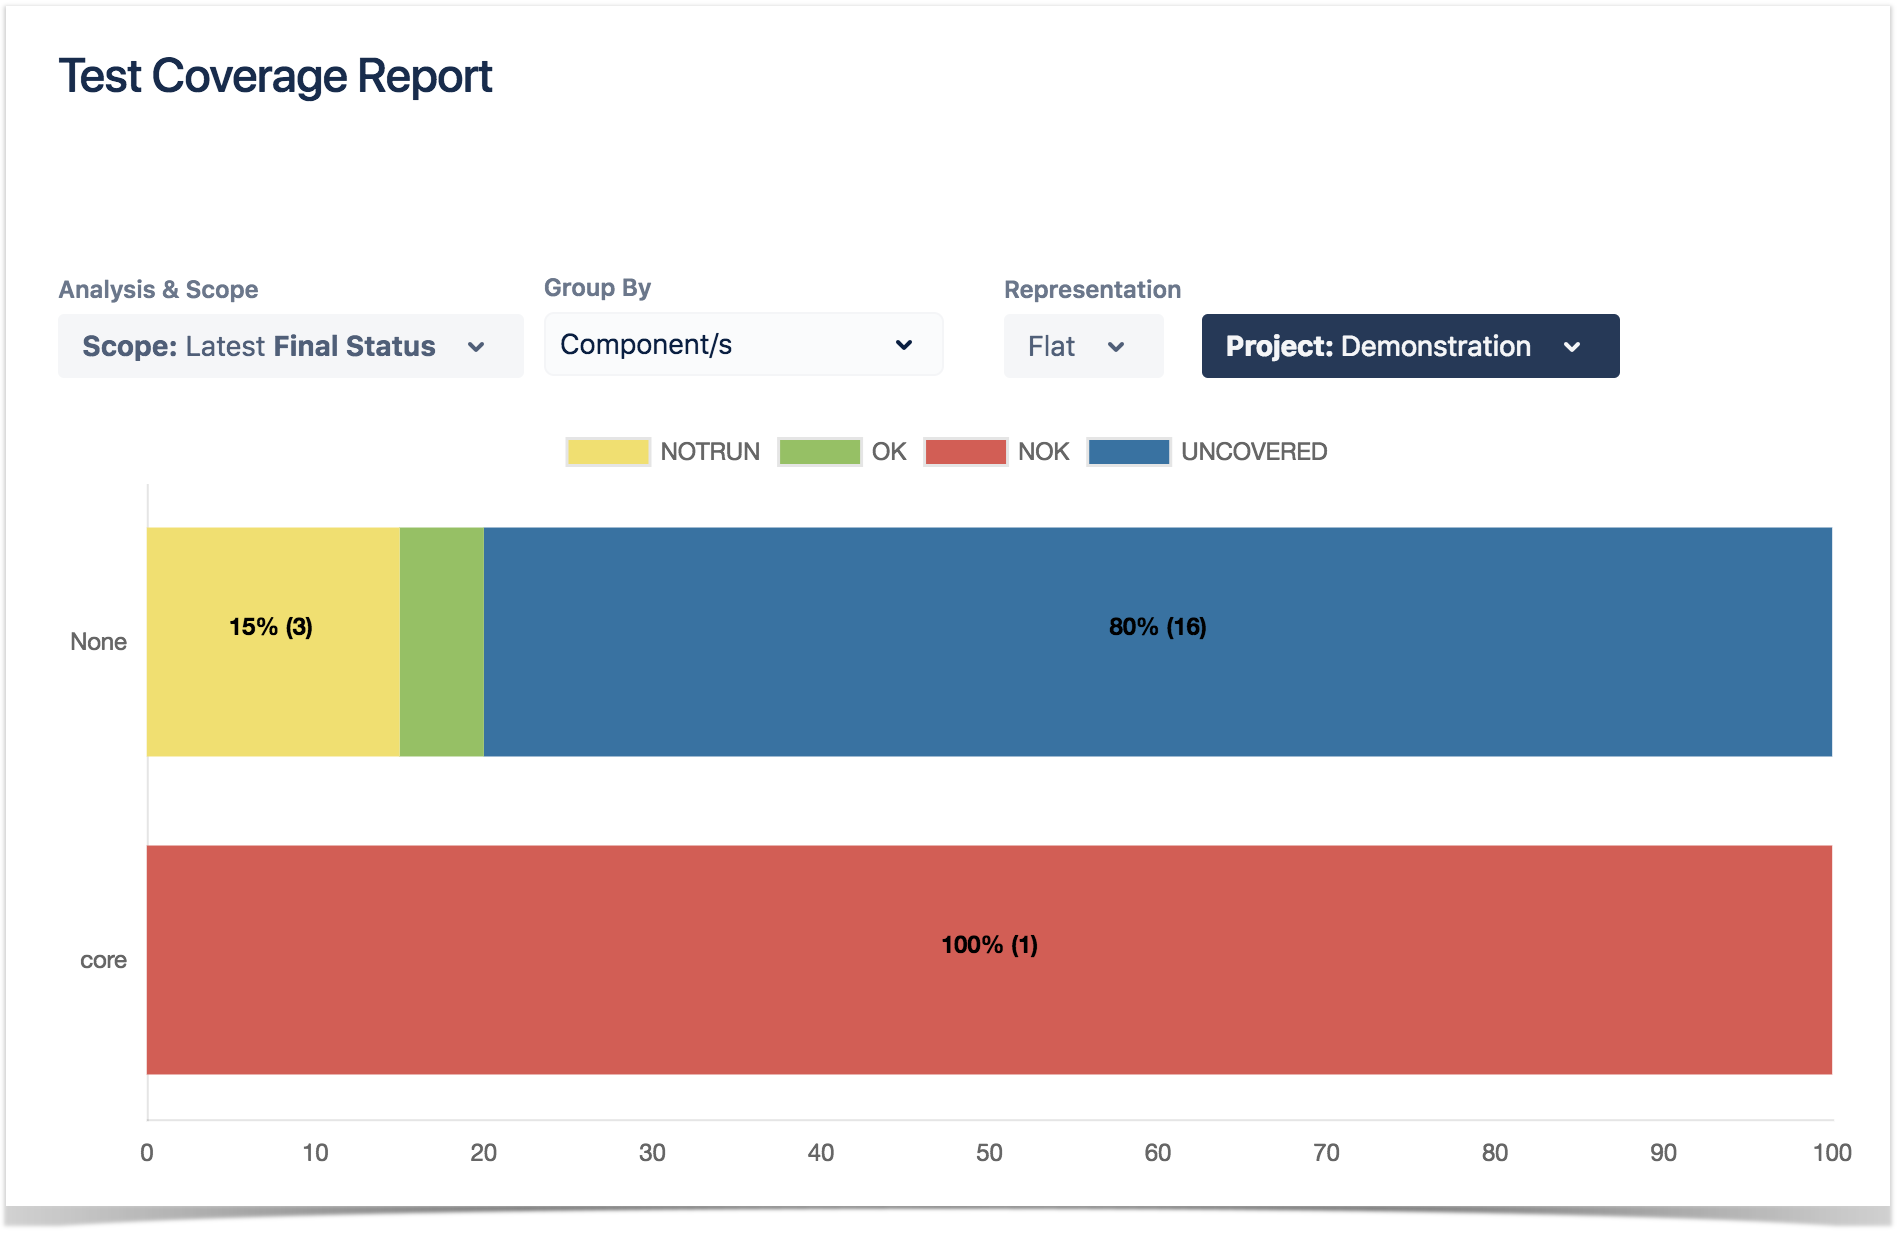
Group ByYou can visually group the requirements by Priority, Component or other fields, so you can analyze requirements from different perspectives.
|
| UI Steps | ||||||||||||||||||||||||||||||||
|---|---|---|---|---|---|---|---|---|---|---|---|---|---|---|---|---|---|---|---|---|---|---|---|---|---|---|---|---|---|---|---|---|
Group ByYou can visually group the requirements by Priority, Component or other fields, so you can analyze requirements from different perspectives.
|