Page History
...
| UI Steps | |||||||||||||||||||||||||||||||||||||||||||||||||||||
|---|---|---|---|---|---|---|---|---|---|---|---|---|---|---|---|---|---|---|---|---|---|---|---|---|---|---|---|---|---|---|---|---|---|---|---|---|---|---|---|---|---|---|---|---|---|---|---|---|---|---|---|---|---|
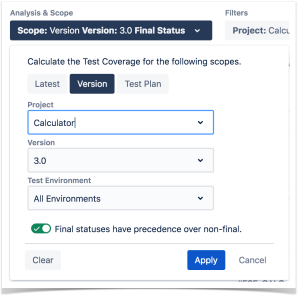
UI Step | Defining Scope with Advanced TabAlternatively to the Basic, the Advanced tab offers the possibility of filtering the requirements via JQL:
If you wish, you can clear the filter in order to see all Requirements once again. You can do this by clicking on the Clear button and then press Apply. Understanding the reportThe issues and values that are shown in the report take into account the options selected for analysis, namely, the relevant Test Executions and corresponding Test Runs and defects. The report not only shows the traceability between entities, but it also presents some calculated values for the selected options. For example, the requirement status and the Test status that are shown in the Requirements and Tests columns, respectively.
|