This report enables you to evaluate some relevant metrics of Test Executions and compare them between different cycles
The Test Executions List Report shows a list of Test Execution issues and their corresponding execution status. A Test Execution status is shown as a progress bar with the latest Test Run status from each Test issue that is associated with that Test Execution.
Possible usage scenarios:
analyze both the progress of
the
each Test Executionand the success rate
(i.e., the % of Tests contributing to the requirement's OK status)
analyze
see
the number of
manual Tests vs. others in the
defects opened in each Test Execution
see the overall execution status (i.e., the current status of the Test Runs)
see the number of opened/closed linked defects, in the context of the Test Execution
analyze the testing results for some revisions of the SUT
see the planned Test Executions for some version, for some Test Environment and get an overview of the progress of each one of them
UI Step
How to Use
This report is accessible either from theXray
Reportsicon
icon on the project left sidebar or from the standardReportsicon, which includes other kinds of reports besides Xray.
At the top of the report you'll find two areas related with the report and with the data shown in the report.
Image Removed
A: Filter, for selecting the source data
B: visualization information and options
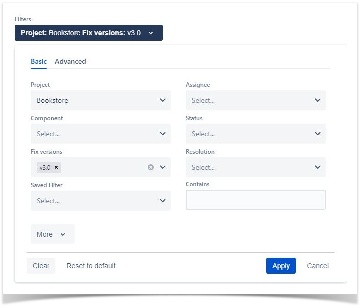
Source Test Execution issues can be directly provided using a advanced filter or by specifying some Test Execution-related fields:
Advanced: a JQL query to filter the coverable issues
Basic:
Project:project
Assignee: the issue's assignee
Component: the component assigned to the issue
Fix Versions: versions assigned to the issue
Resolution: the workflow resolution
Status: the workflow status
Contains: the full issue key or part of the summary
Image Added
UI Step
Defining Scope
Source Test Execution issues can be directly provided (within section A) using a saved filter or by specifying some Test Execution-related fields:
Saved filter: a saved filter containing Test Execution issues
Fix Version: the version assigned to the Test Plan
Assignee: the Test Execution issue assignee
Status: the Test Execution issue Status
Resolution: the Test Execution issue Resolution
Test Plan: the assigned Test Plan
Environment: the assigned Test Environment
Image RemovedImage Added
UI Step
Columns
Aside from the available custom fields for Test Execution issues, there are some special columns that can be included:
Metrics
Metric
Notes
total tests
Revision
Number
The revision of
Tests in
the
Test Execution; it also corresponds to the number of test runs
number of tests by status
Number of Tests/Test Runs, per Test Run status
number of tests by test type
Number of Test Execution's Tests, per Test Type
progress
Overall progress; % of Test Runs with a final status
success rate
SUT targeted by this Test Execution (i.e., typically the code revision or the build number)
Begin Date
Planned begin date for the Test Execution
End Date
Planned end date for the Test Execution
Test Environment(s)
Test Environment(s) linked to the Test Execution
% of "successful" Tests
(i.e.,
whose latest status contributes
the environment assigned to the
OK requirement status; the PASS Test Run status is an example of such a status)
Elapsed time
Sum of the elapsed time of Test Runs that have been or are being executed
linked defects (open/closed)
Test Execution where tests were executed on or are scheduled to be executed on)
Defects
Number of linked defects (i.e., the ones created/linked during the execution of tests)
Status
The progress
Defects directly associated with the related Test Runs. Will count as unique Defects
(i.e.,
if the same Defect issue is added multiple times in the same Test Run or os added multiple times within Test Runs of the same Test Execution, it will count as one)Defects with Resolution will be counted in the Closed column; all others will be counted in the Open column.
the overall execution status of the Test Execution)
UI Step
Example
Image RemovedImage Added
The report may be a bit wide for some screen resolutions so you will need to scroll horizontally to see the rest of the information.
Some values provide a link, so you can be redirected to the respective entities.
UI Step
Export and Share
The report may be a bit wide for some screen resolutions so you will need to scroll horizontally to see the rest of the information.
Some values provide a link, so you can be redirected to the respective entities.
Image Removed
Image Added
The report can be shared by copying and sending the URL located in the browser's address bar.
When opening the report the Filter will be automatically populated with the values provided in the URL.