
Page History

| Table of Contents |
|---|
Overview
Learn how to use Analysis to understand specific interaction coverage after every scenario.
Coverage Matrix
Click on the “Analysis→ Coverage Matrix” menu link to use this feature:
Understanding the Matrix
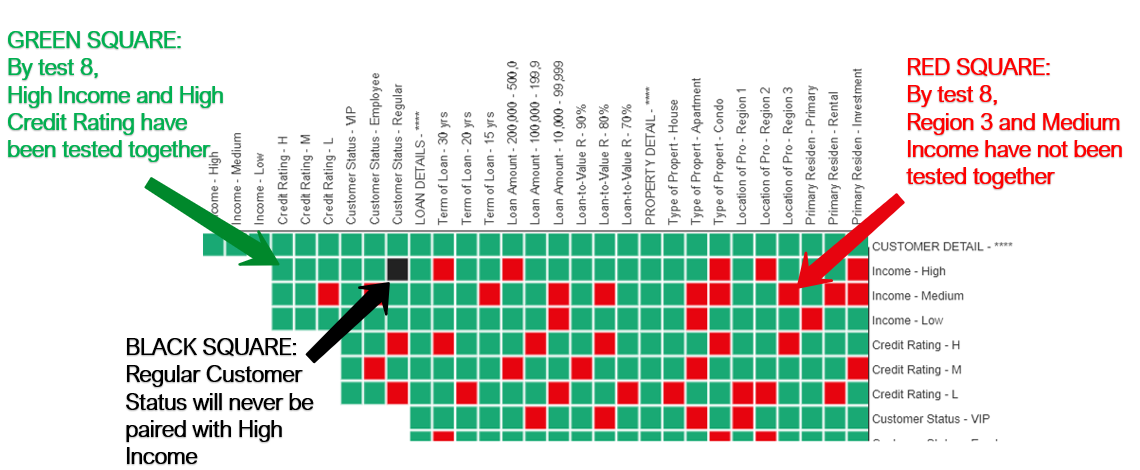
Each square of the matrix chart represents a pair. How to read the chart:
...
- If it is green: the pair is already covered.
- If it is red: the pair is not covered yet given the scenario you selected via slider.
- If it is black: the pair is marked as invalid.

Slide your way to precise coverage

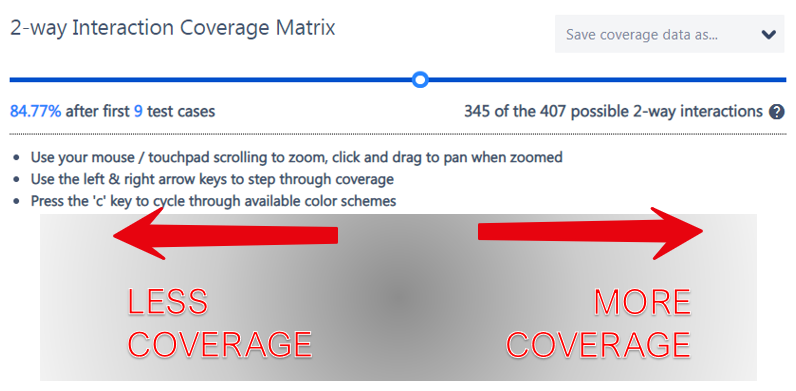
The slider at the top allows you to visualize which pairs are covered with each test.
...
With the Matrix Chart, communicating your testing coverage has been made even easier! Imagine a situation where you have created some tests and your manager comes by and says, “Development is running behind, so we’ll only have time to execute 2/3s of your tests before Go-Live. What will be missed?” You can easily respond with a slide like the one below:

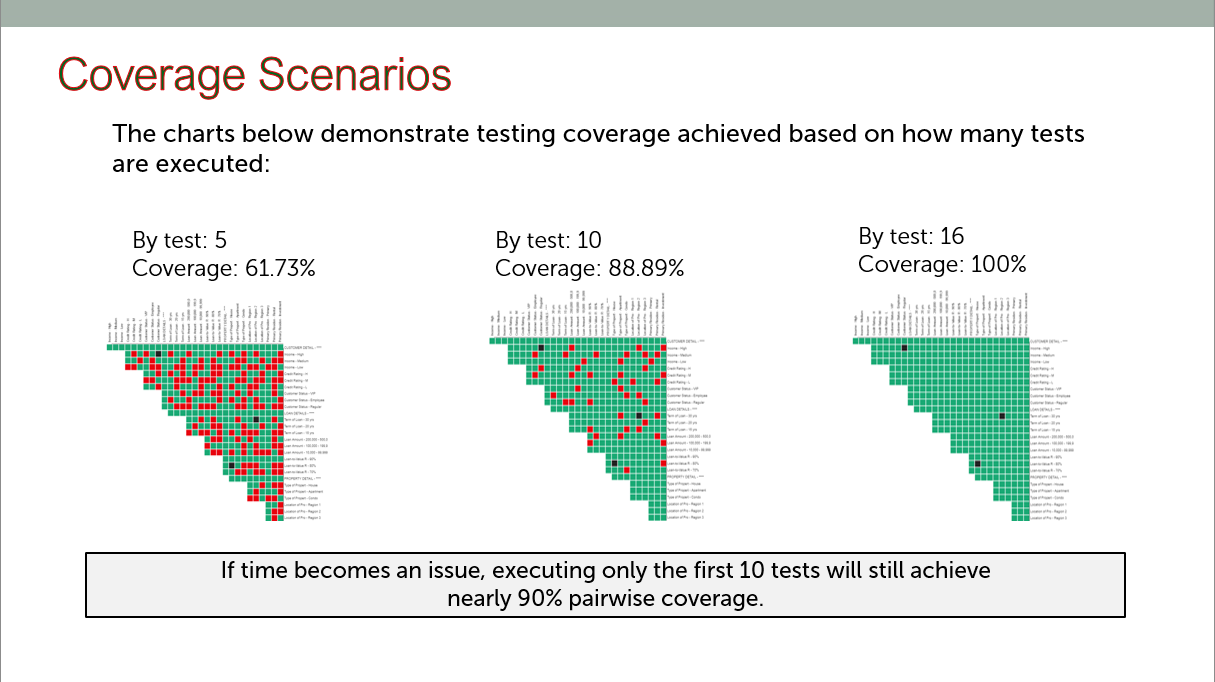
With this information in mind, you can then weigh the testing options. Do we need to test for this 2-way interaction which is still a gap by test 10? Is it worth generating 6 more test cases? Are we better off adding a forced interaction to bump that pair's priority? The Coverage Matrix can be invaluable in the decision-making process.
...
The key difference is that the Graph can be applied to any generated strength (3-way, etc.) but will only show the cumulative coverage percentage, not the specific interactions:
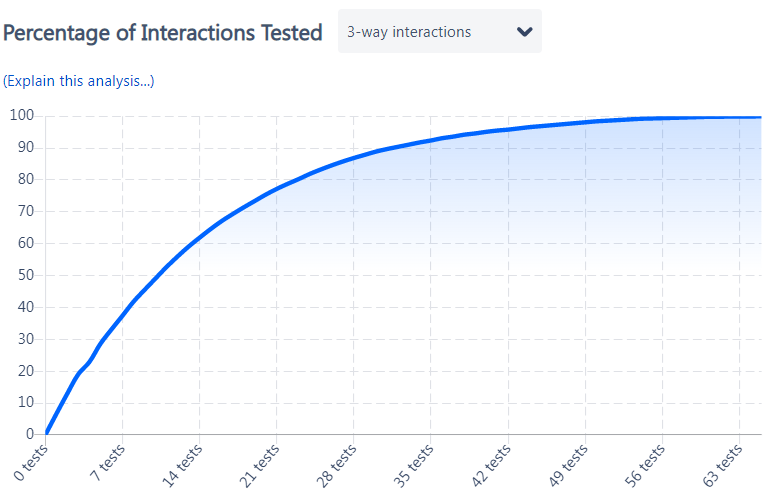

The shape of the curve is important to highlight: Xray Test Case Designer algorithm frontloads as much variation as possible, therefore the diminishing returns on incremental coverage improvement are reach fairly fast and the scenarios in the later part of the test suite do not contribute nearly as much as the first few.
Note: the order is based on the Index column from the Scenarios screen. Sorting the data table in a different way does not impact the Graph or Matrix as they always display the recommended execution priority. If you want to analyze the modified Scenarios table, you have to either freeze it or manually re-import it as Forced Interactions.
| Info |
|---|
A few important points to consider when analyzing coverage information
|