Page History
| UI Steps | ||||||||
|---|---|---|---|---|---|---|---|---|
|
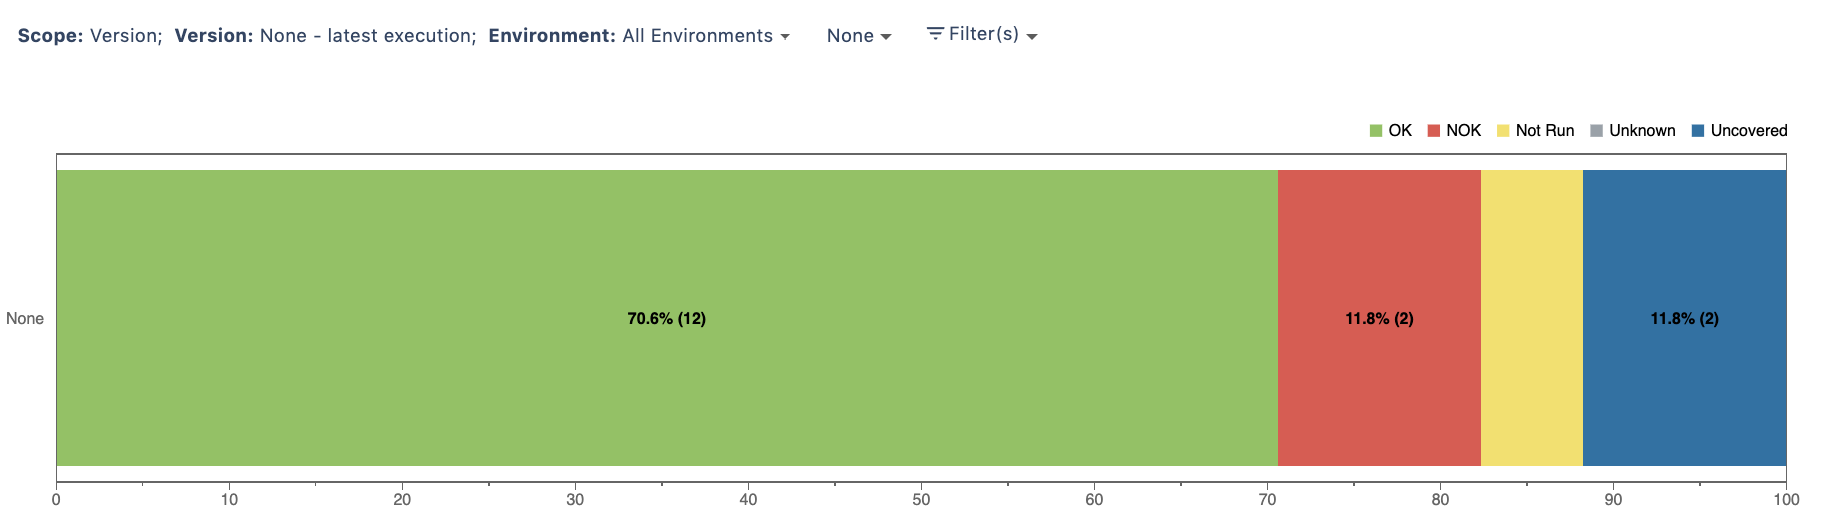
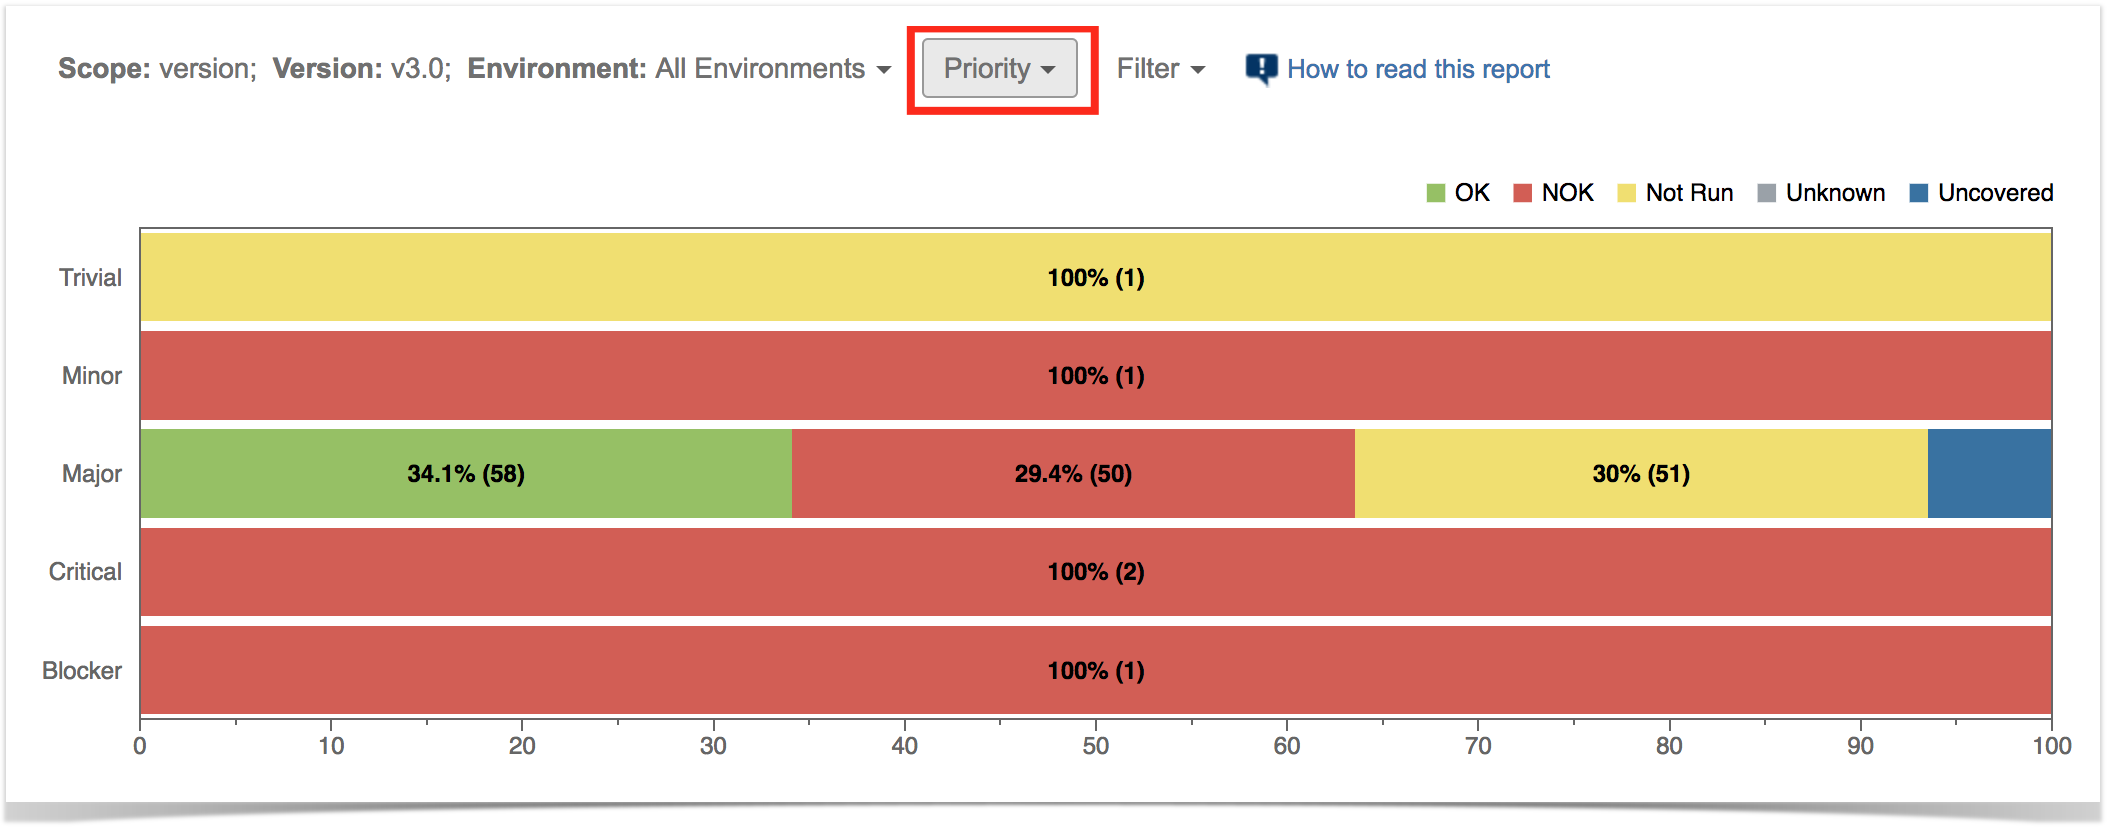
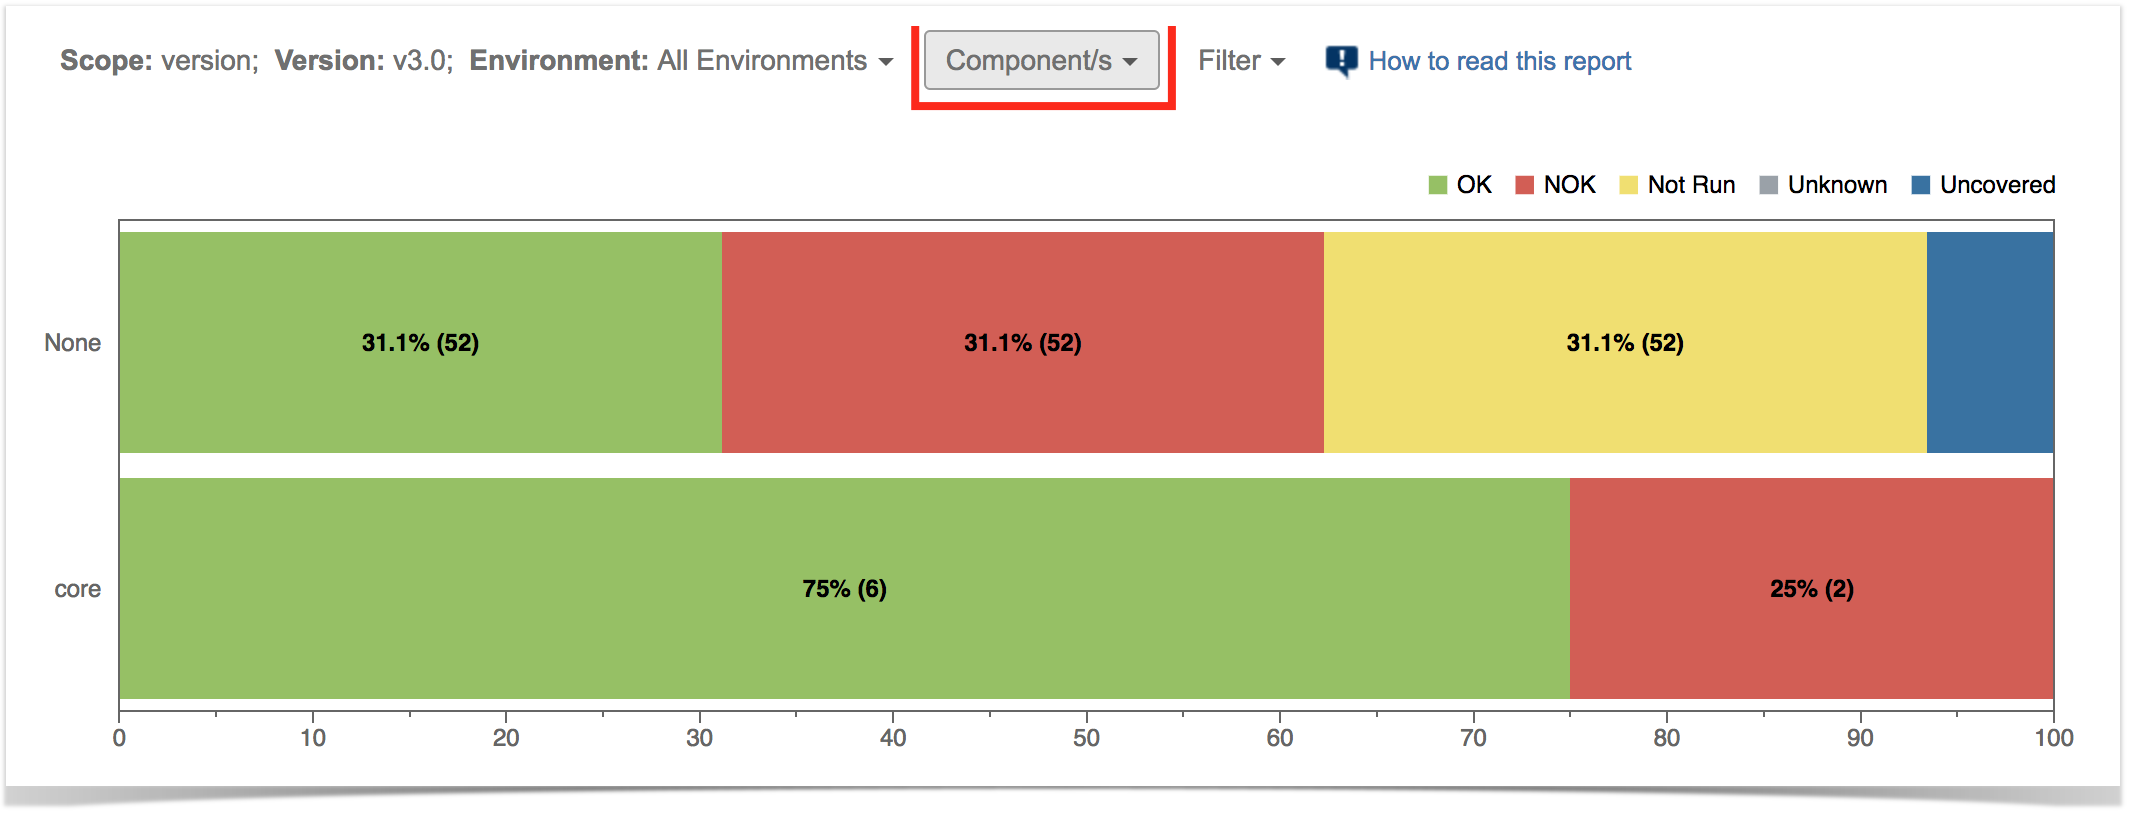
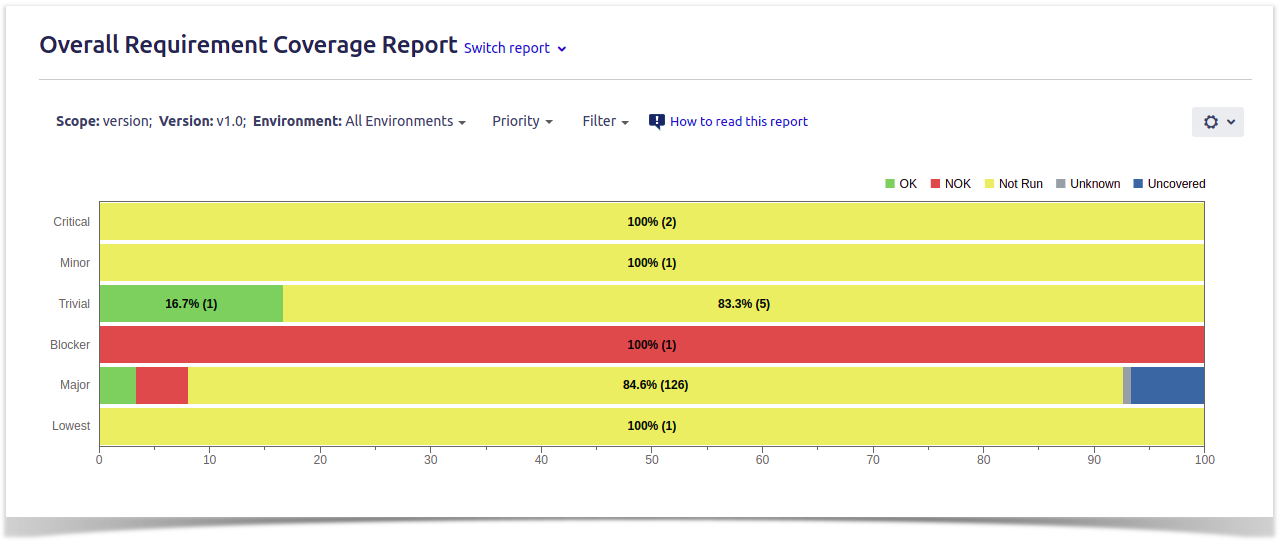
Shows a normalized horizontal stacked bar chart with the current Requirements coverage for the selected Analysis Version (or Test Plan), Test Environment and Grouping field.
![]()
| Note | ||
|---|---|---|
| ||
To use this report, your project must have Requirements Coverage enabled. Check out Configure Jira project to be used as Requirements project. |
| Table of Contents |
|---|
Purpose
In order to analyze the current status of your release, or even other releases from the past, you need to evaluate the status of requirements, taking into account the respective results.
You might want to analyze just the requirements implemented in a given version or you may want to analyze requirements from earlier versions based on your regression testing.
The overall requirements coverage report provides the means to analyze your requirements statuses in real-time.
How to use
This report is accessible either from the Xray Reports icon on the left sidebar of the project or from the standard Reports icon, which includes other kinds of reports besides Xray.
At the top of the report you'll find several areas related with the report and with the data shown in the report.

- A: Analysis & Scope, for choosing how to analyze the entities
- B: Group by, for defining how to visually group/aggregate items
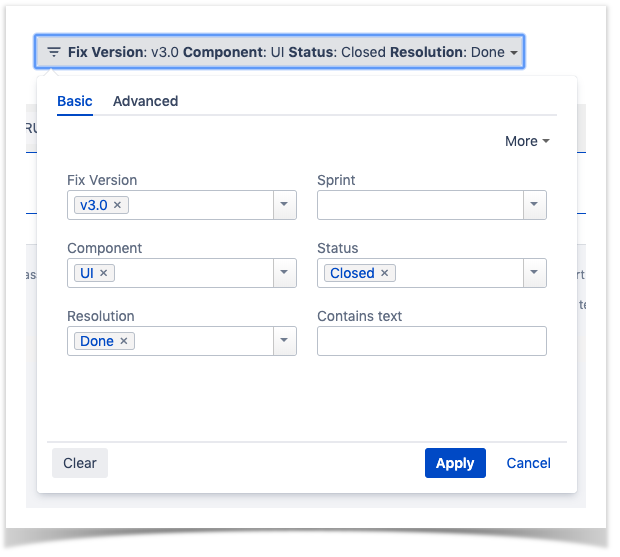
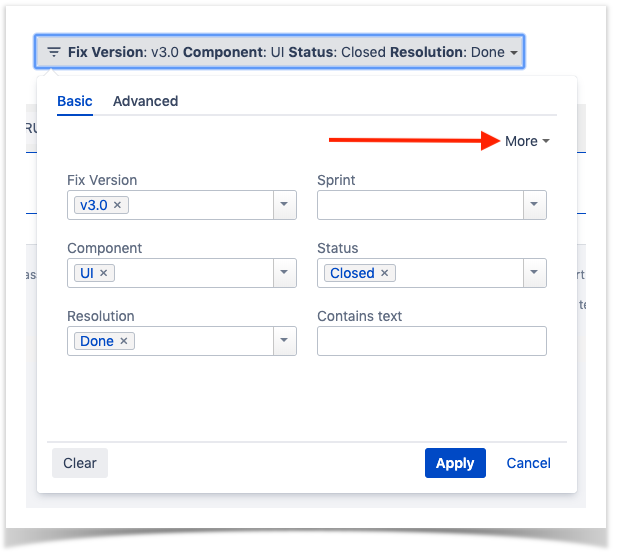
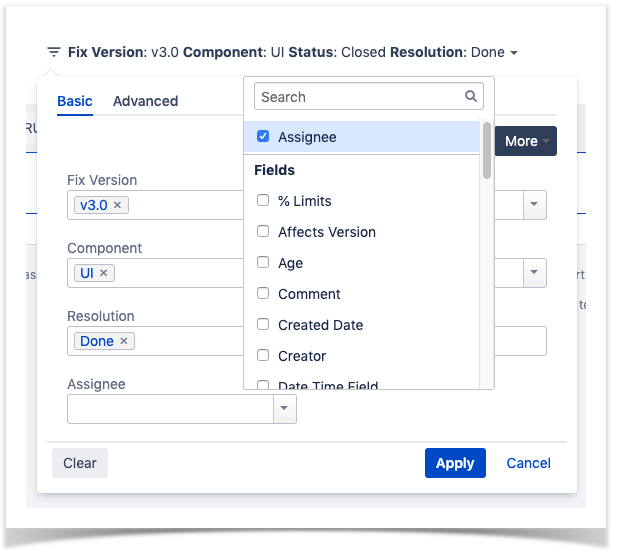
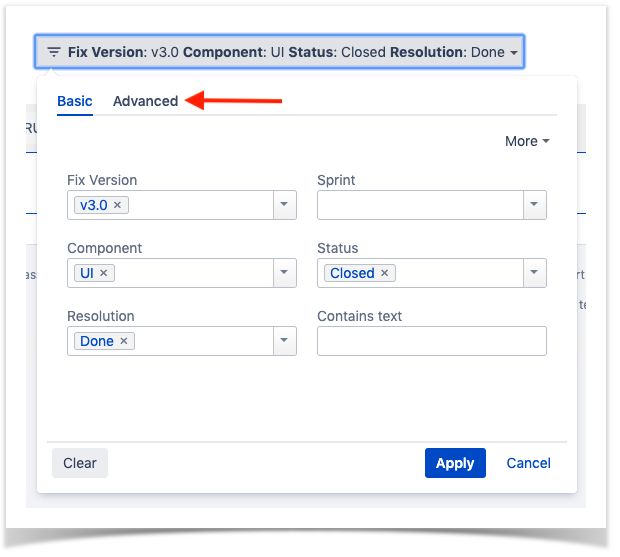
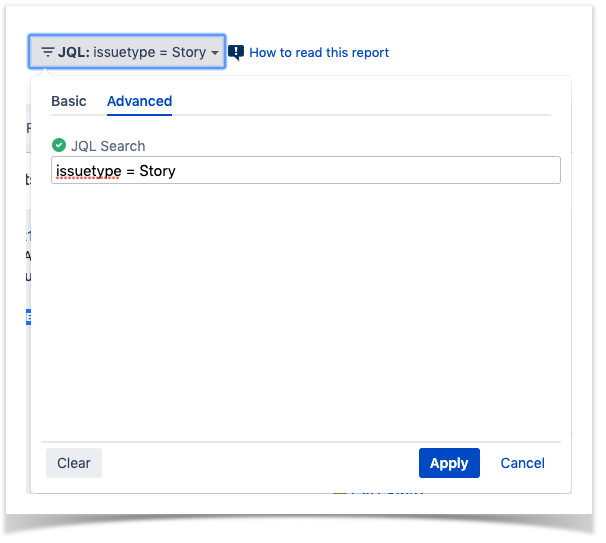
- C: Filter, for selecting the source data
- D: Visualization information and options
You need to configure the source data (i.e., the requirements) for the chart and how to calculate the requirement status for each one of the requirements.
Source data
...
|
...
|
Analysis
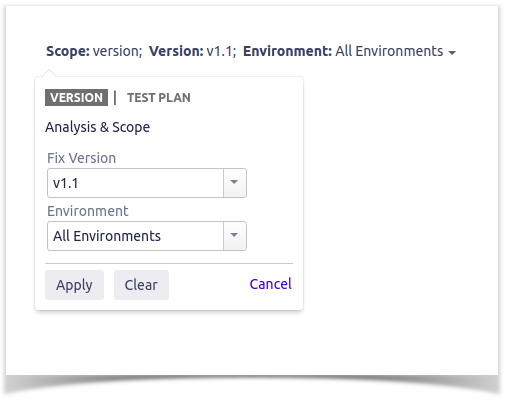
On the left side (within section A), you can define the analysis strategy, i.e., the way you want to analyze the selected/filtered requirements. You can choose either to analyze by Version or Test Plan, and then complement it with a Test Environment.
If you choose analysis by Version, then the latest results from Test Executions for the specified version are taken into account. If you choose Test Plan, only Test Executions (and related results) associated with the given Test Plan are considered during the calculation of the requirement status.
If you specify the Test Environment, then only the executions that ran in the specified environment are considered.
| Info | ||
|---|---|---|
| ||
For more information, please see Coverage Analysis and Understanding coverage and the calculation of Test and requirement statuses. |
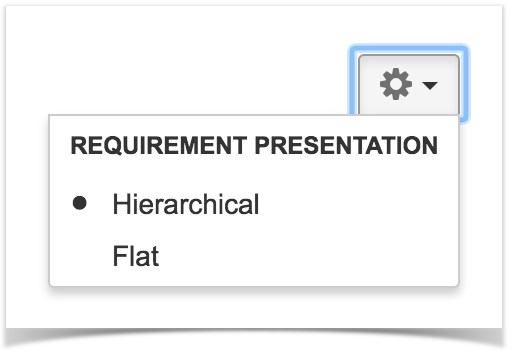
You can visually group the requirements (within section B) by Priority, Component or other fields, so you can analyze requirements from different perspectives.
| Section | ||||
|---|---|---|---|---|
|
| Info | ||
|---|---|---|
| ||
Some Xray global settings may affect the report (e.g."Requirement Coverage Strategy", "Ignore Requirements with statuses", "Ignore Requirements with labels", "Ignore Tests with status") |
|
...
|
...
|
...
|
...
|
...
|

...
|