Page History
...
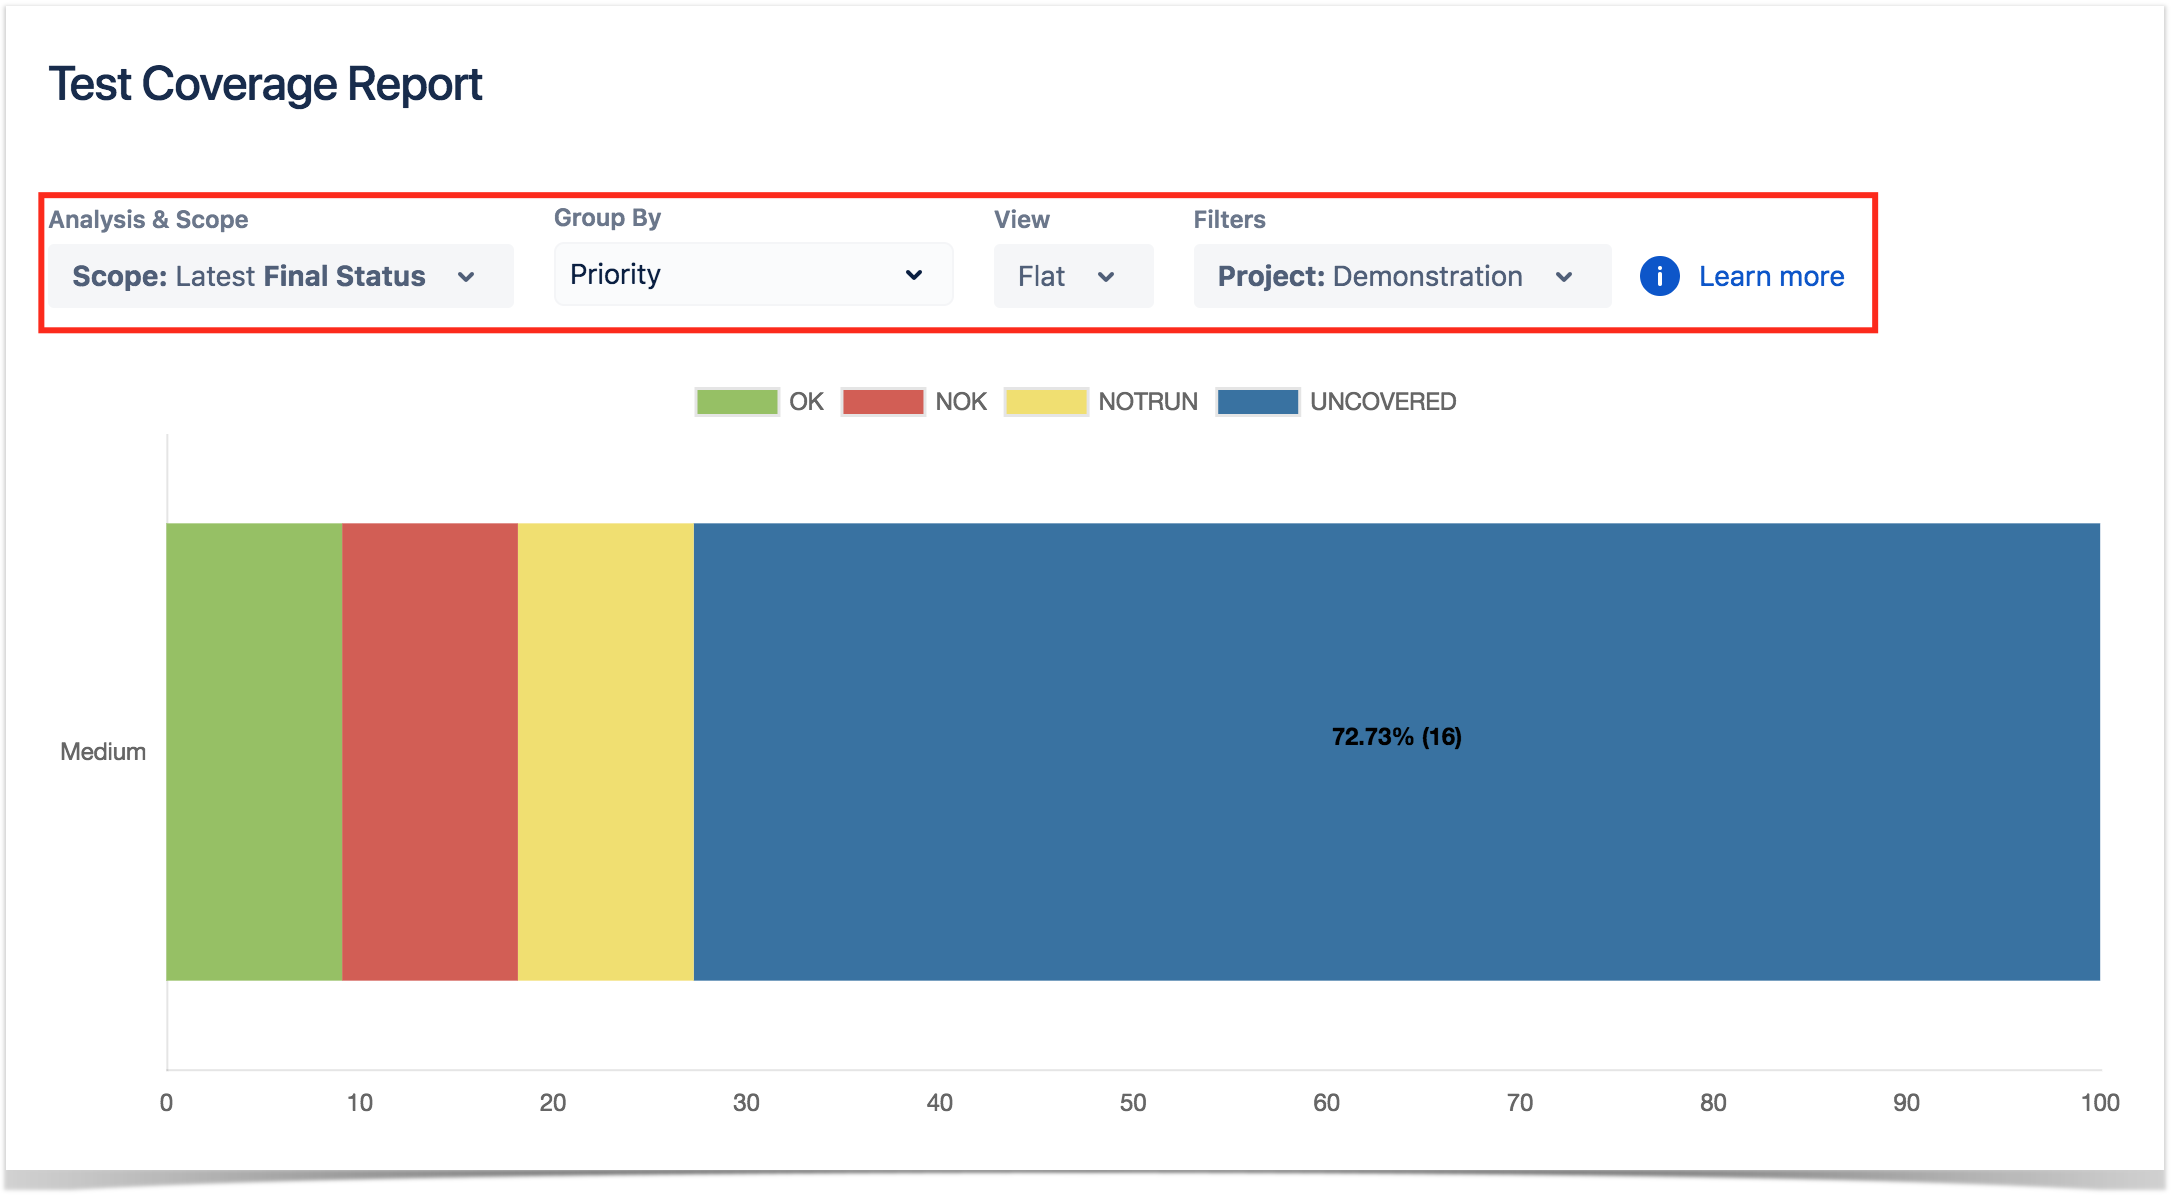
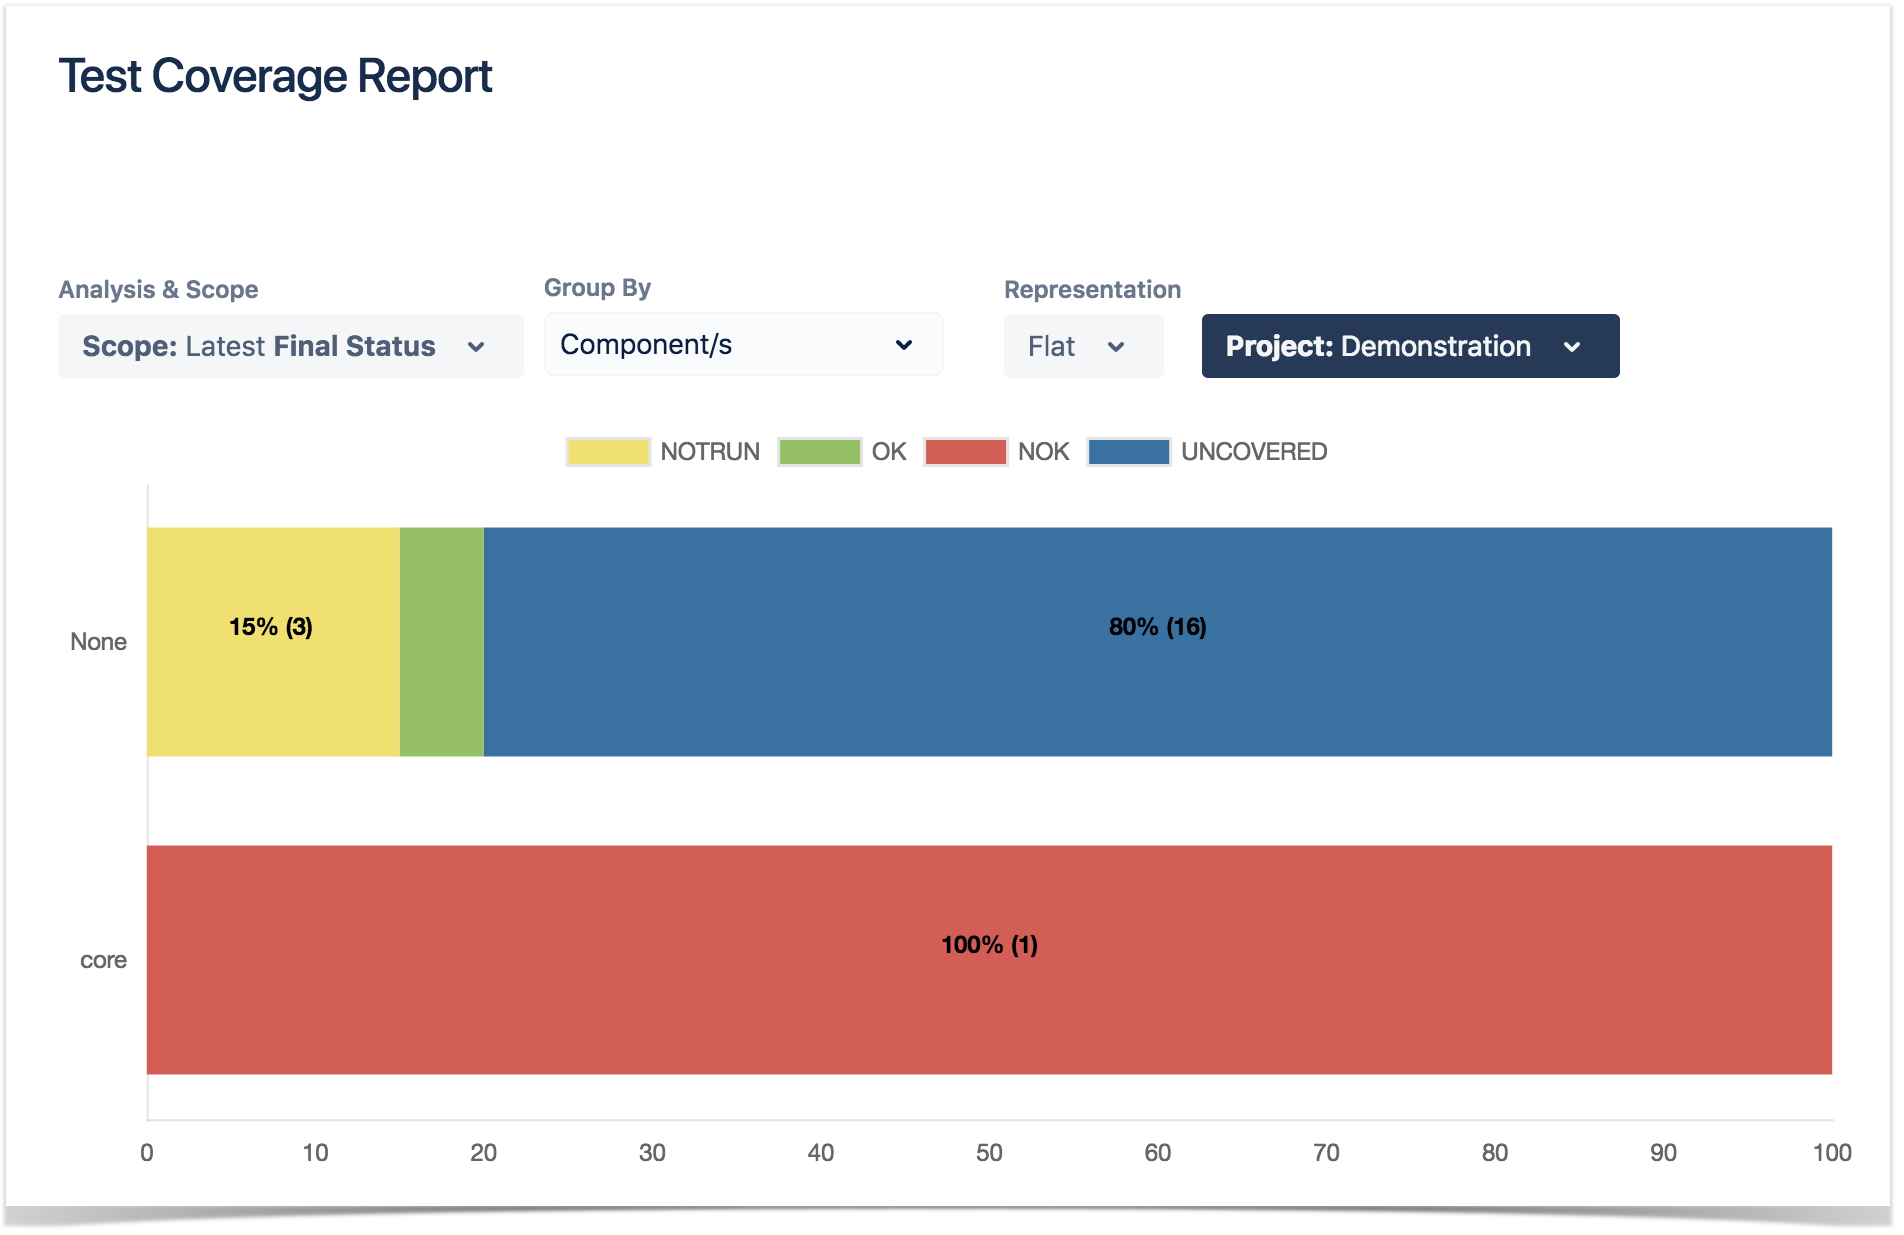
- Analysis & Scope: how to analyze the issues (more info on Coverage Analysis)
- Group By: how to visually group the coverable issues (e.g. by prioriy, by component)
- View: flat ot hierarchical
- Filters: the source data for the report (e.g. the requirements or other covered issues) and how to evaluate the status for each one of the item being shown.
Source data / Filters
...
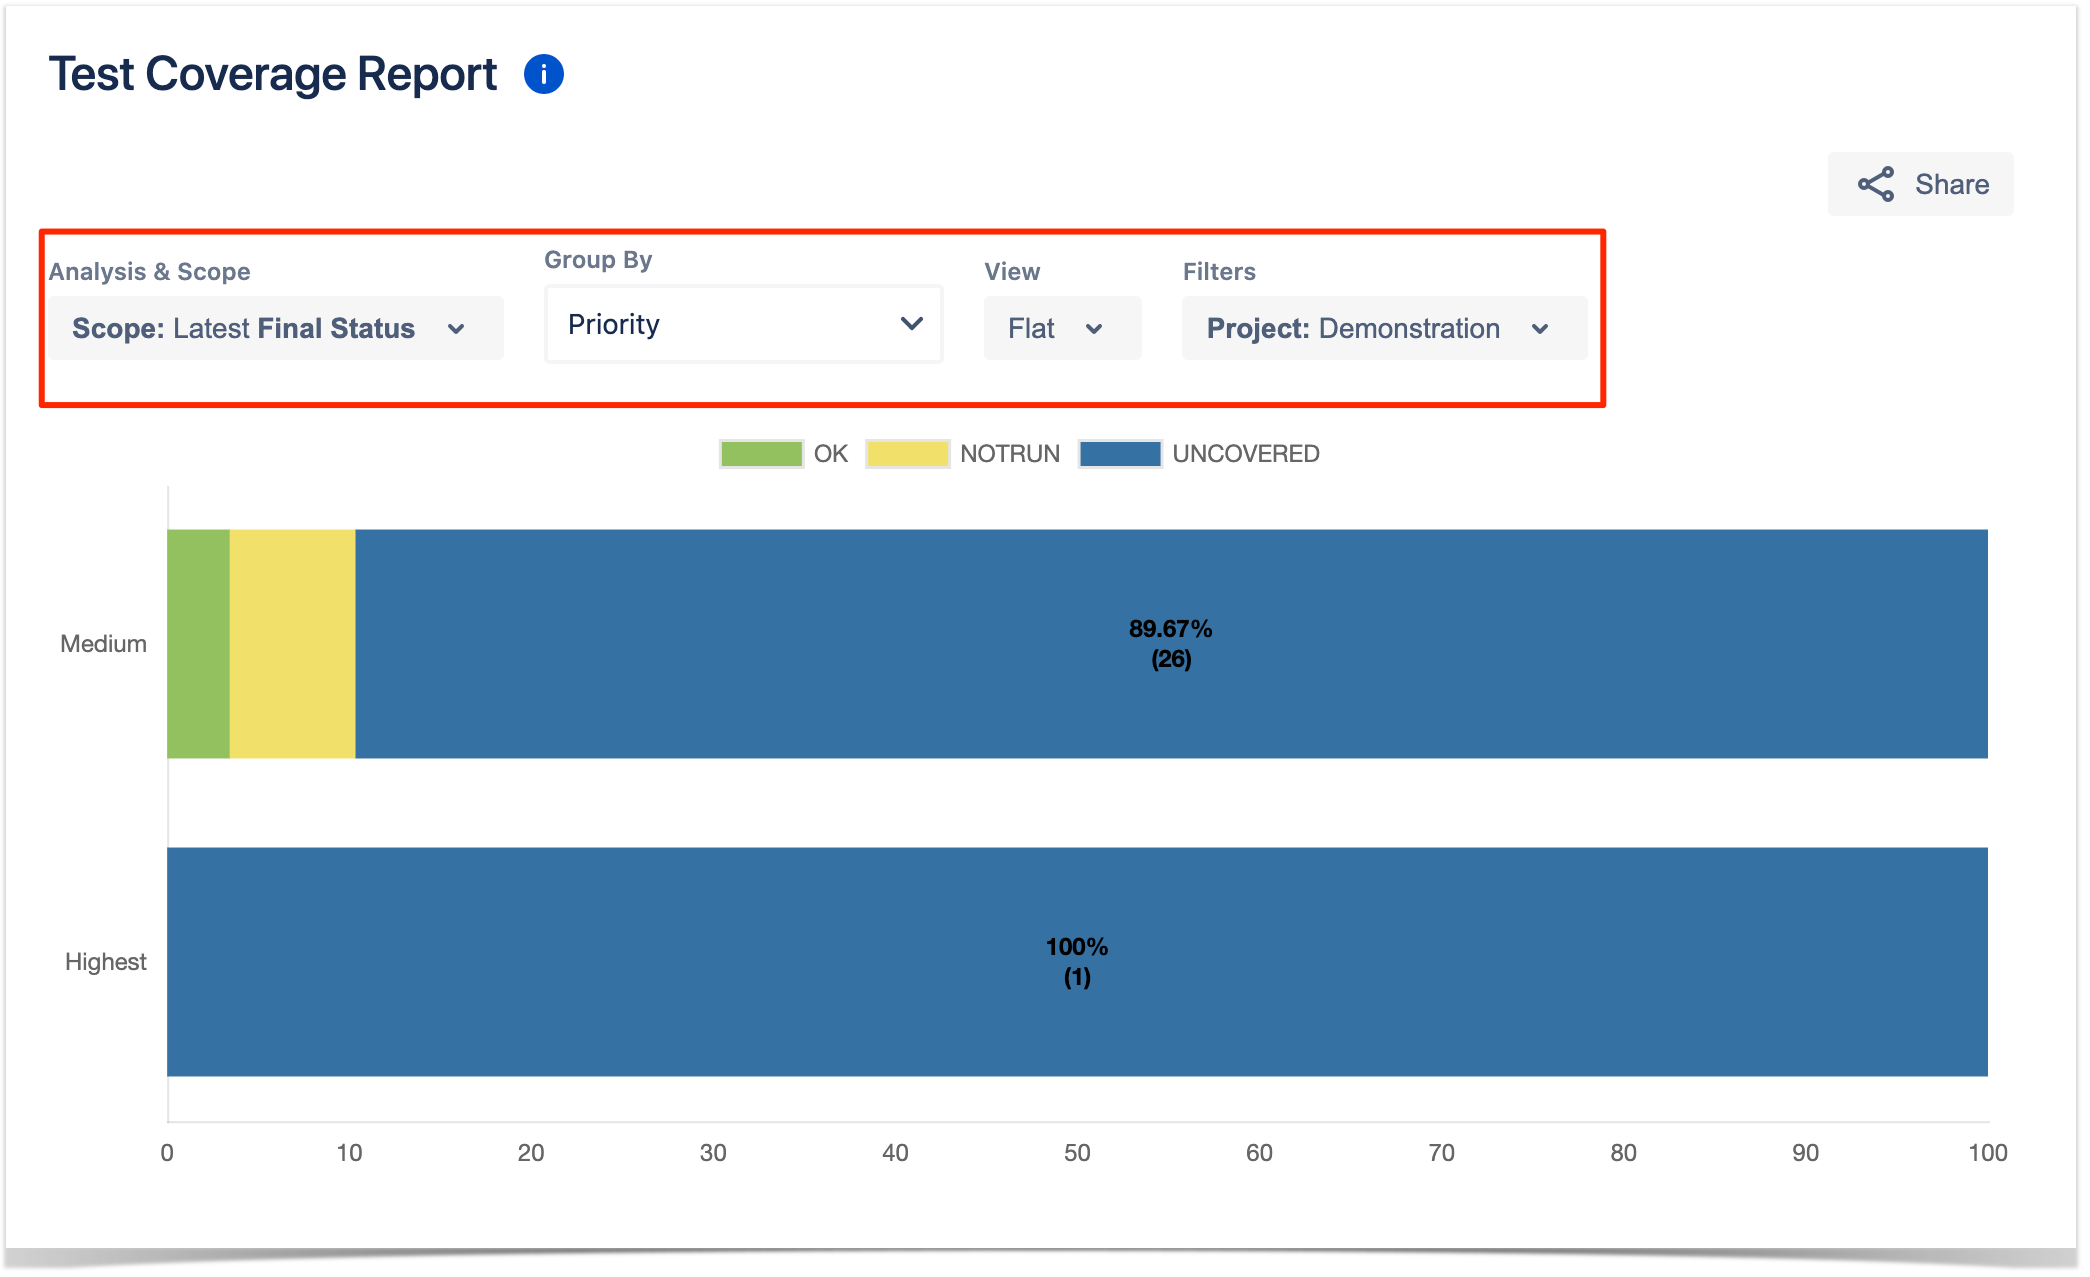
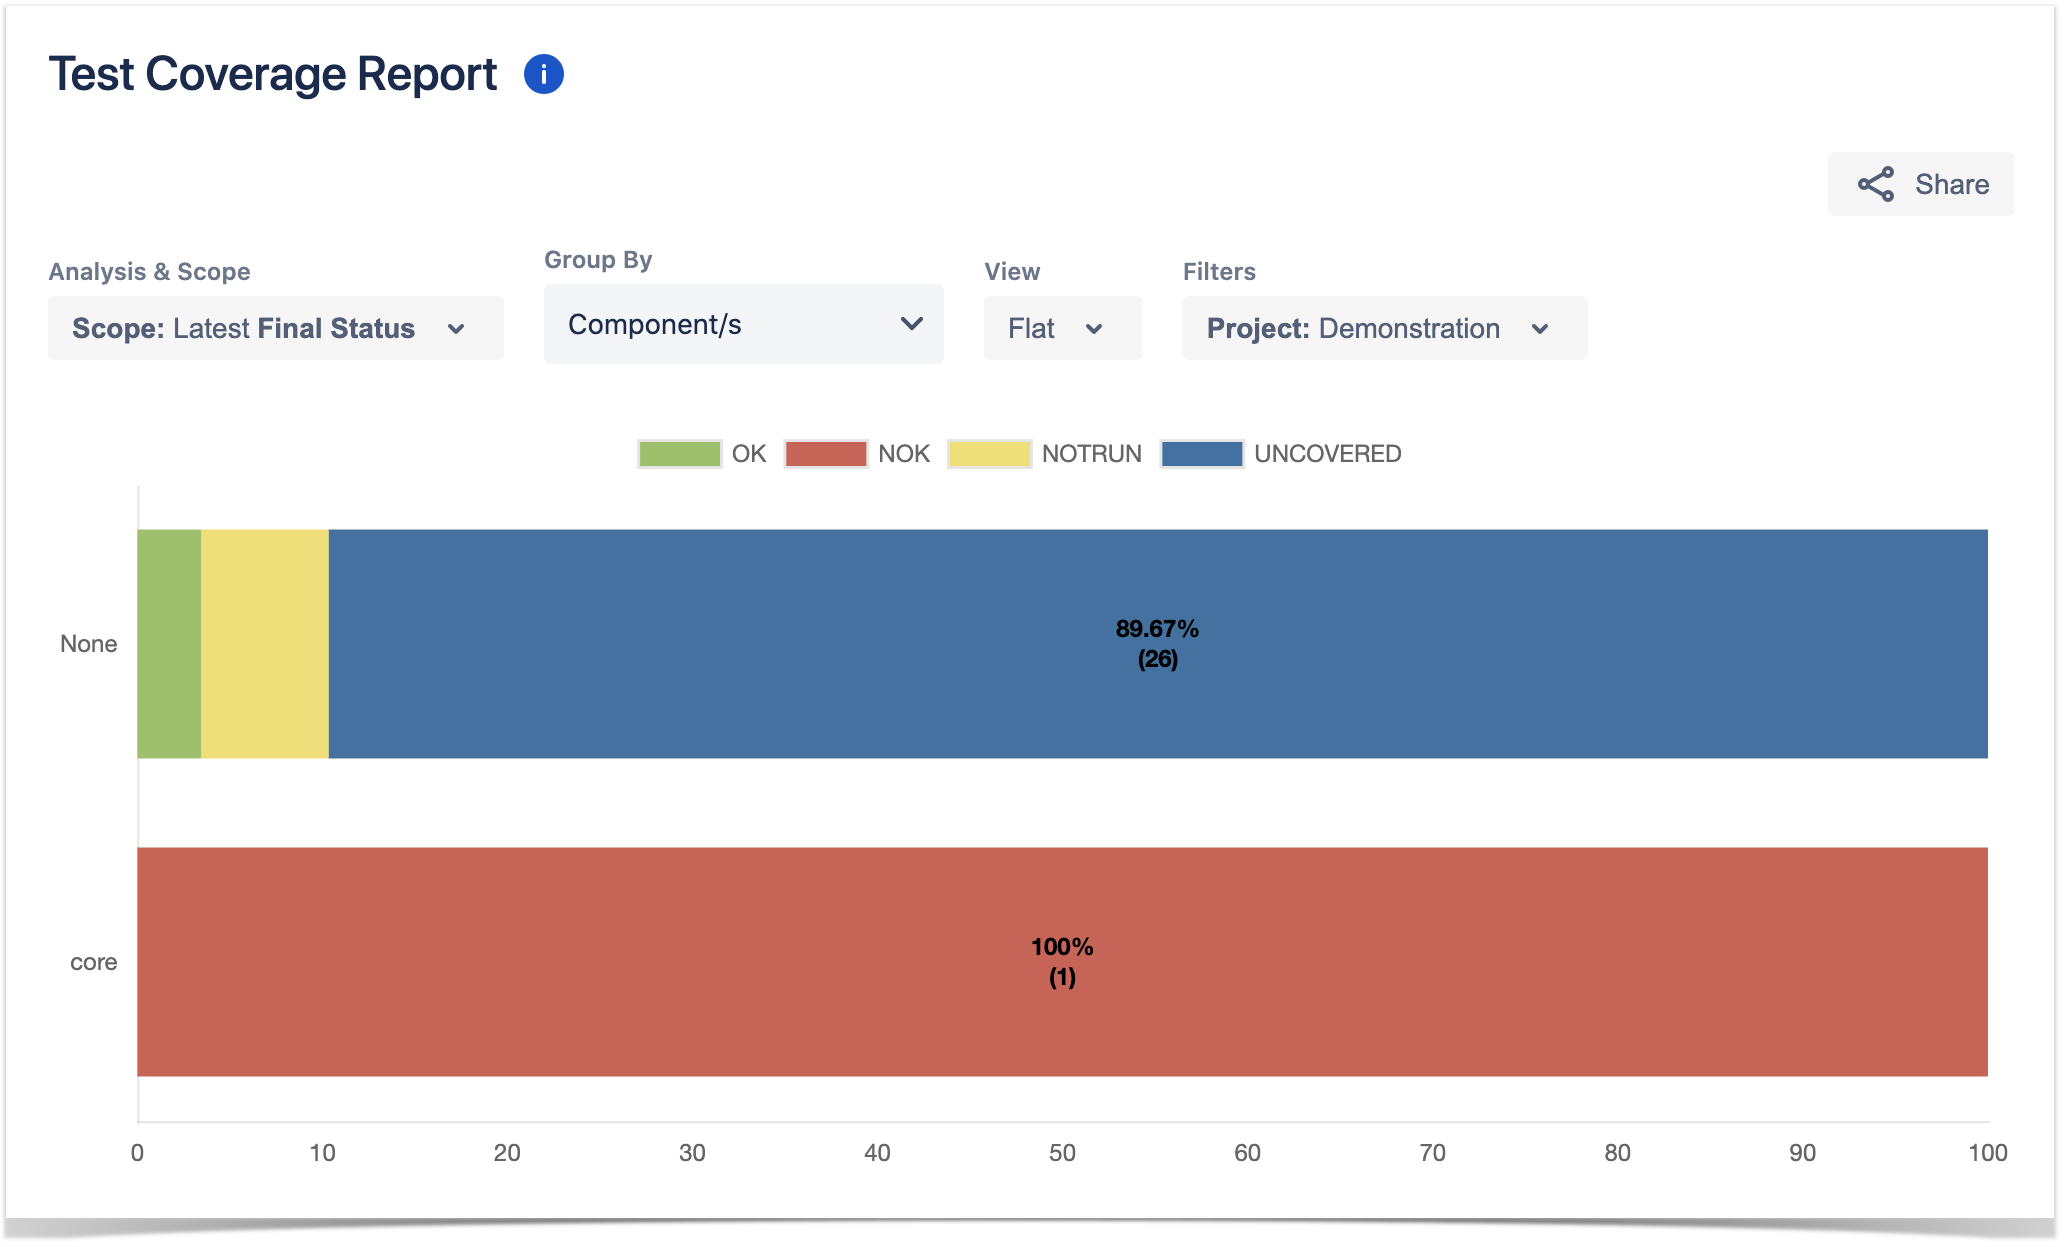
The Overall Coverage requirements chart is interactive. Hovering over each bar shows a small popup with the information on the specific series (Status, Grouping Field and Percentage). You can deactivate a particular series by clicking it in the series legend.
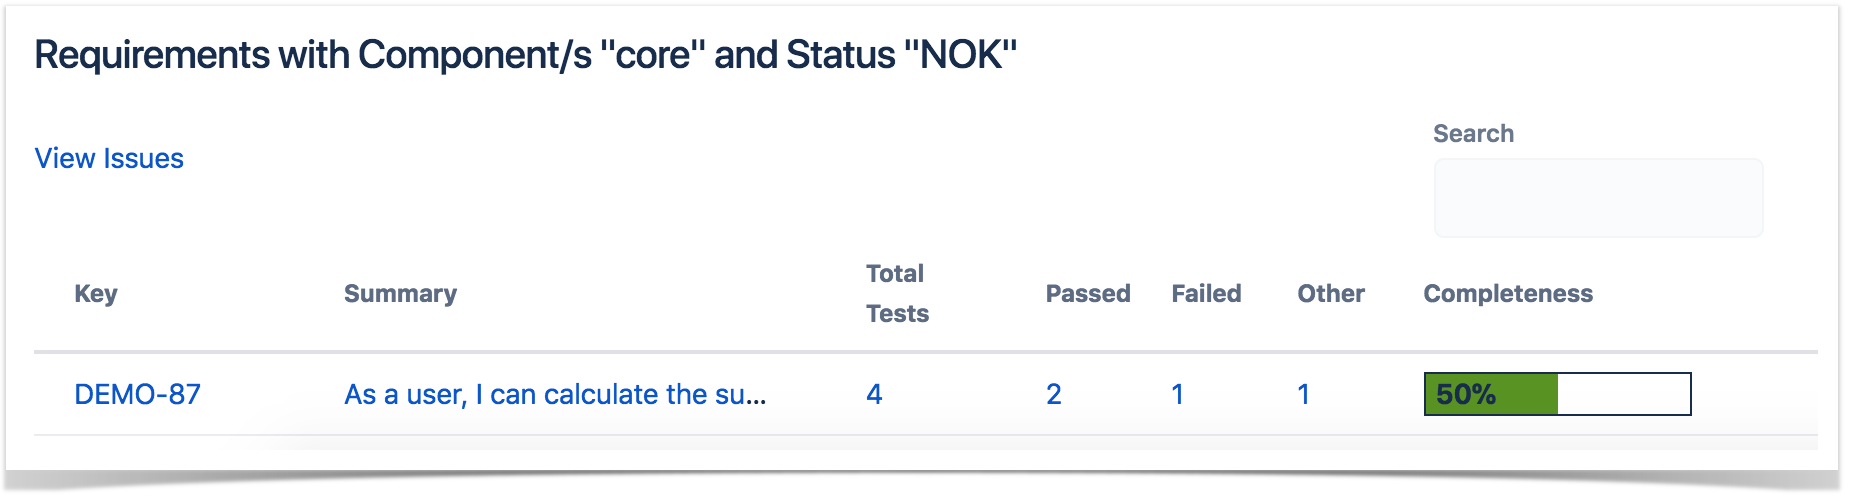
The chart also supports drill-down. When a section is selected, a table appears below the chart with the Requirement issues.
...
Some values may provide a link, so you can be redirected to the respective entities corresponding to the number shown.
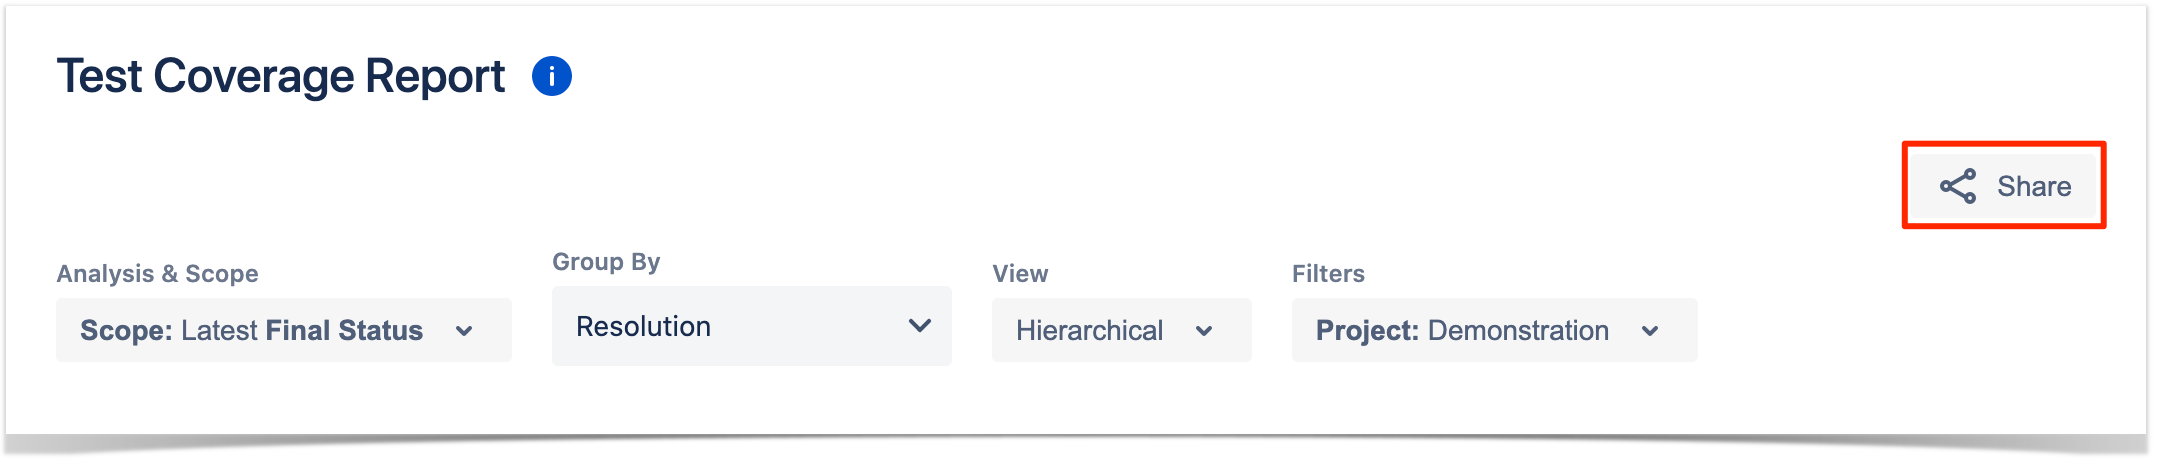
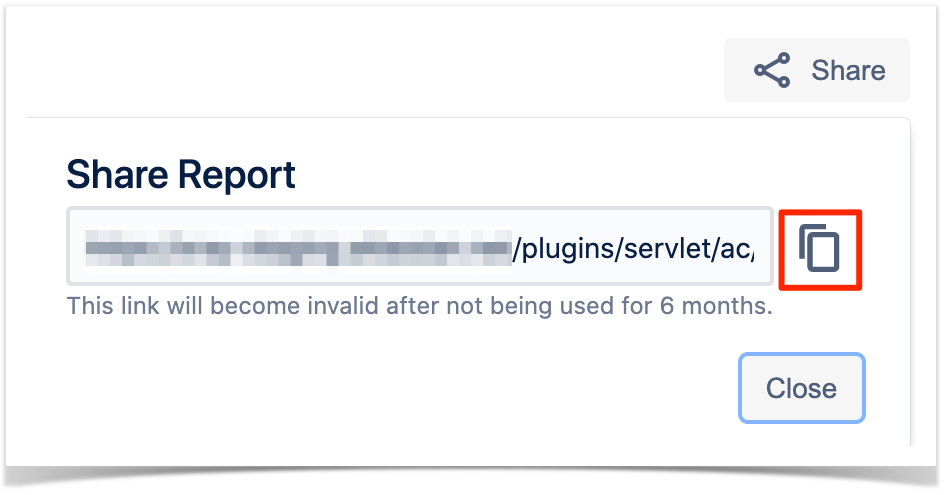
Share
To share the report click the Share button and then click the copy icon to copy the link to clipboard after this you can send the link to other users who can then view the report with the same filters. This link will be deleted if not use for more than 6 months.