Page History
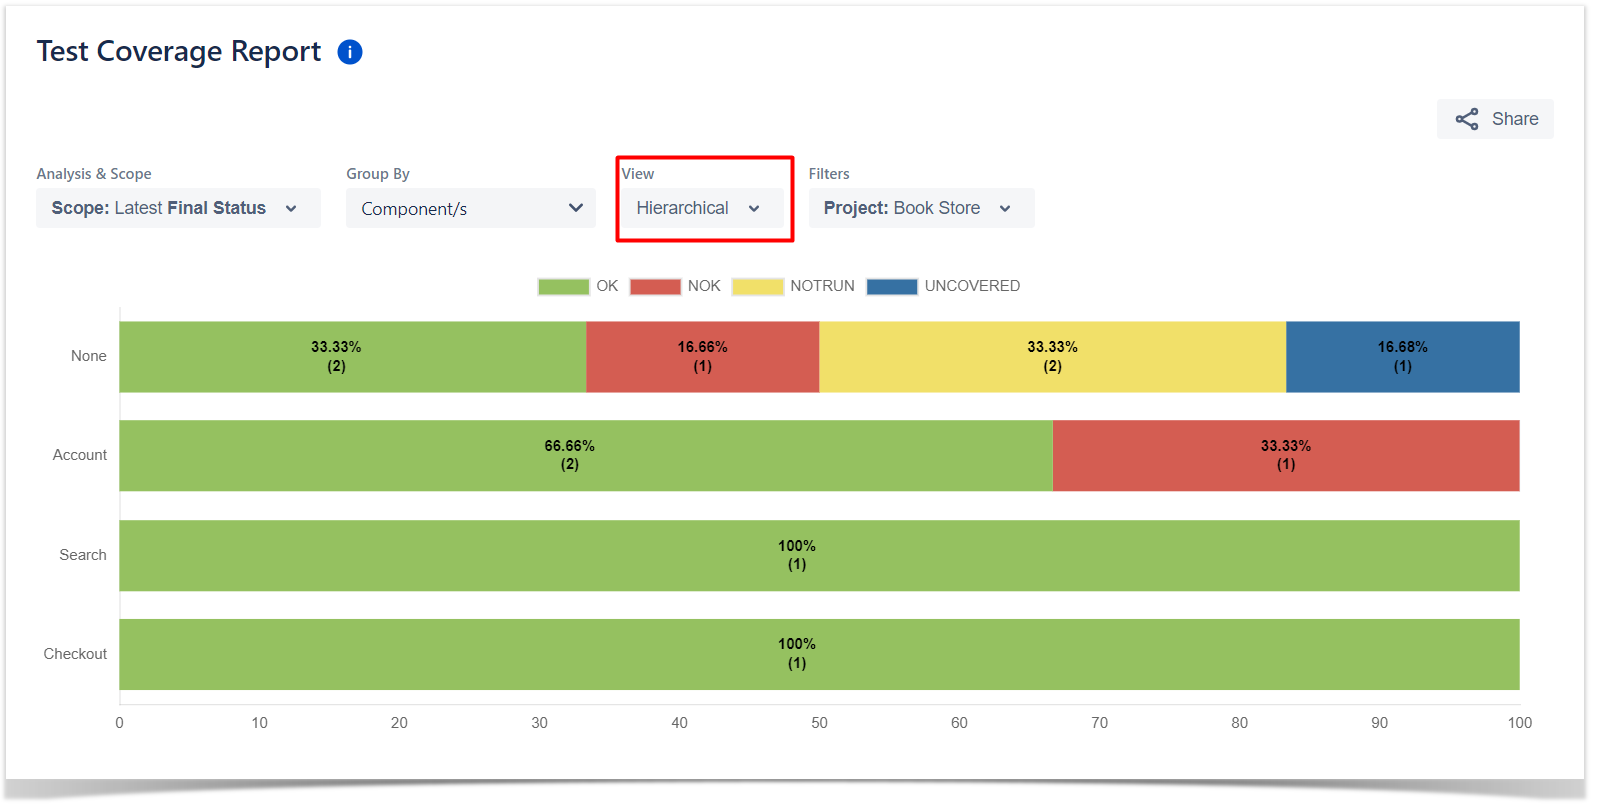
Calculates the test coverage status for a list of coverable issues for the selected version or Test Plan, and/or Test Environment. The statuses are presented in a normalized horizontal stacked bar chart and evaluates evaluate the completeness of each issue.
| Note | ||
|---|---|---|
| ||
To use this report, you must have some configured Issue Types configured as coverable issue types, in the project settings. More info in Project Settings:Test Coverage |
...
You might want to analyze just the requirements implemented in a given version, or you may want to analyze requirements from earlier versions based on your regression testing.
...
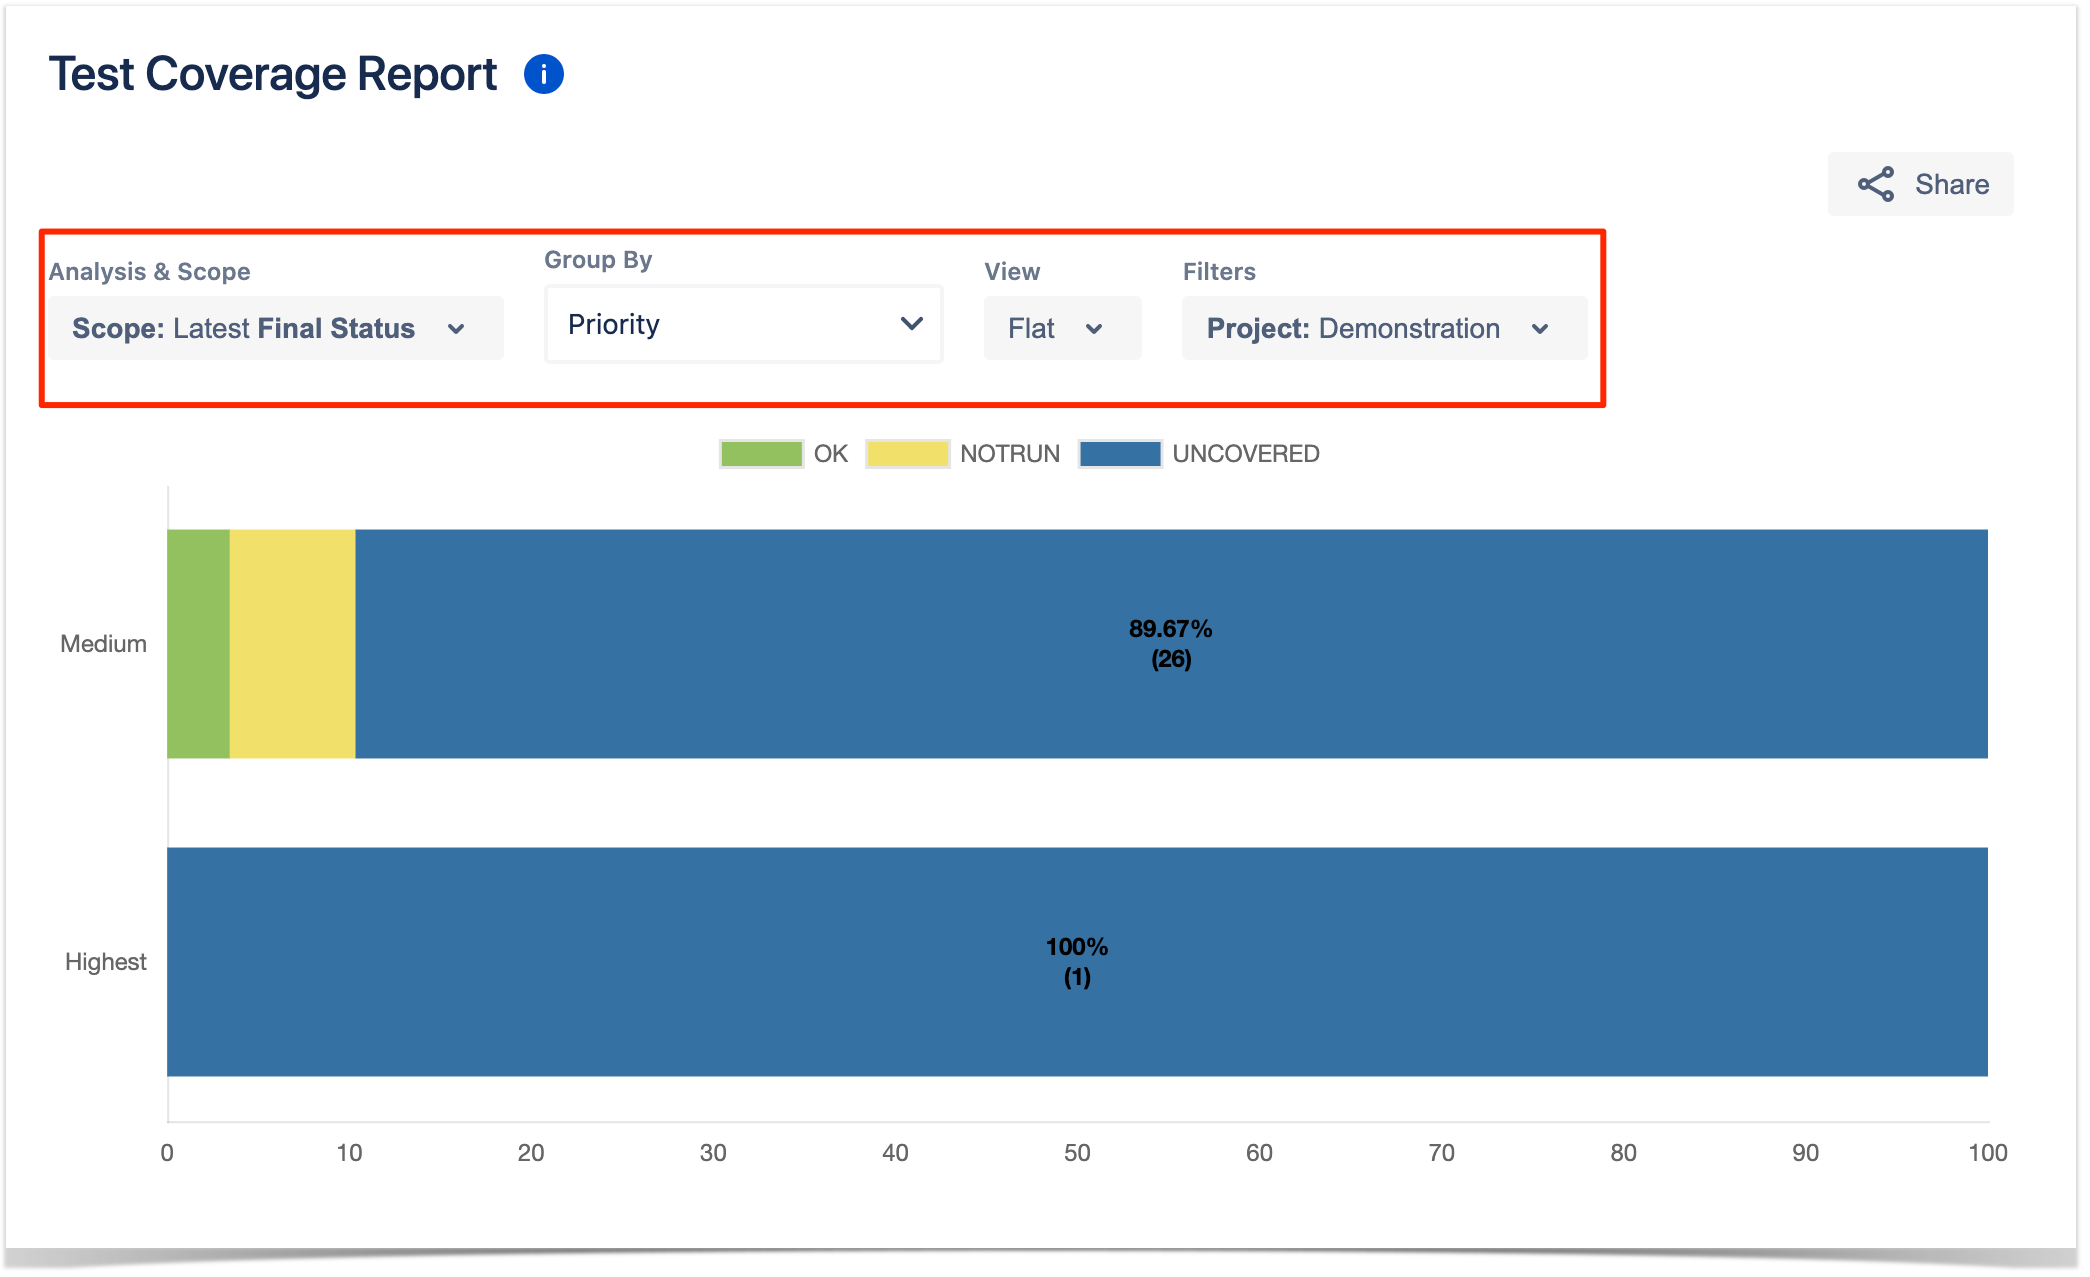
At the top of the report, you have some options that need to be configured.
- Analysis & Scope: how to analyze the issues (more info on Coverage Analysis);
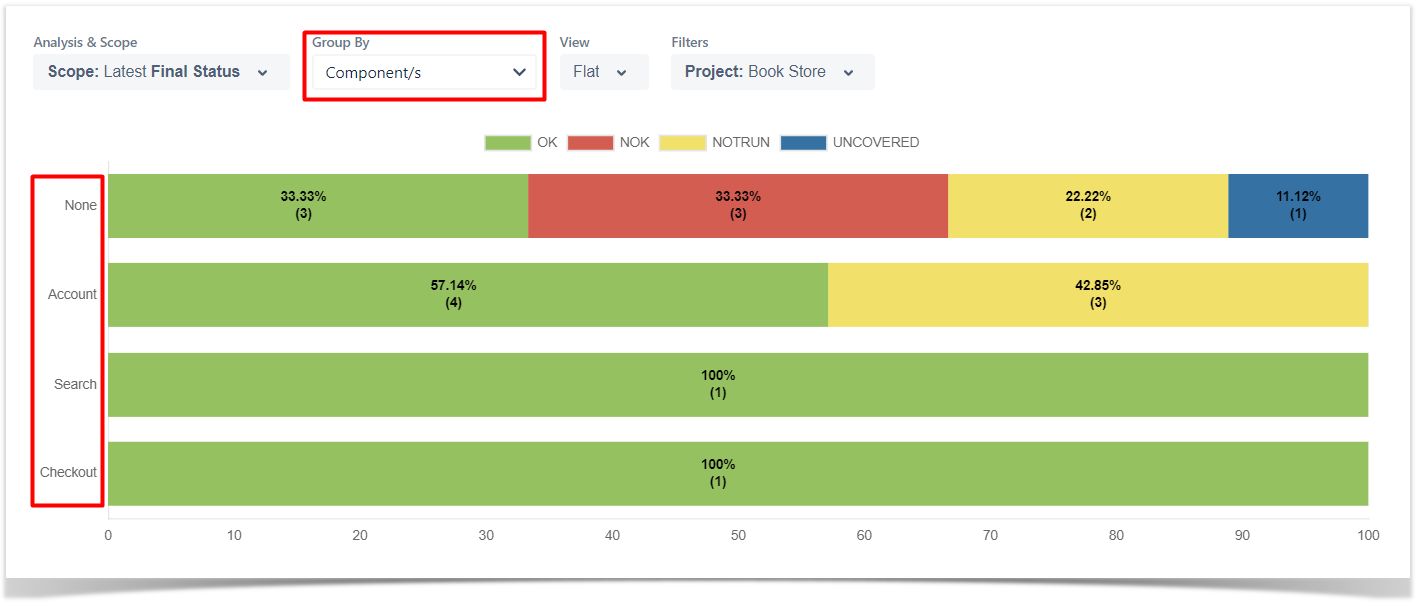
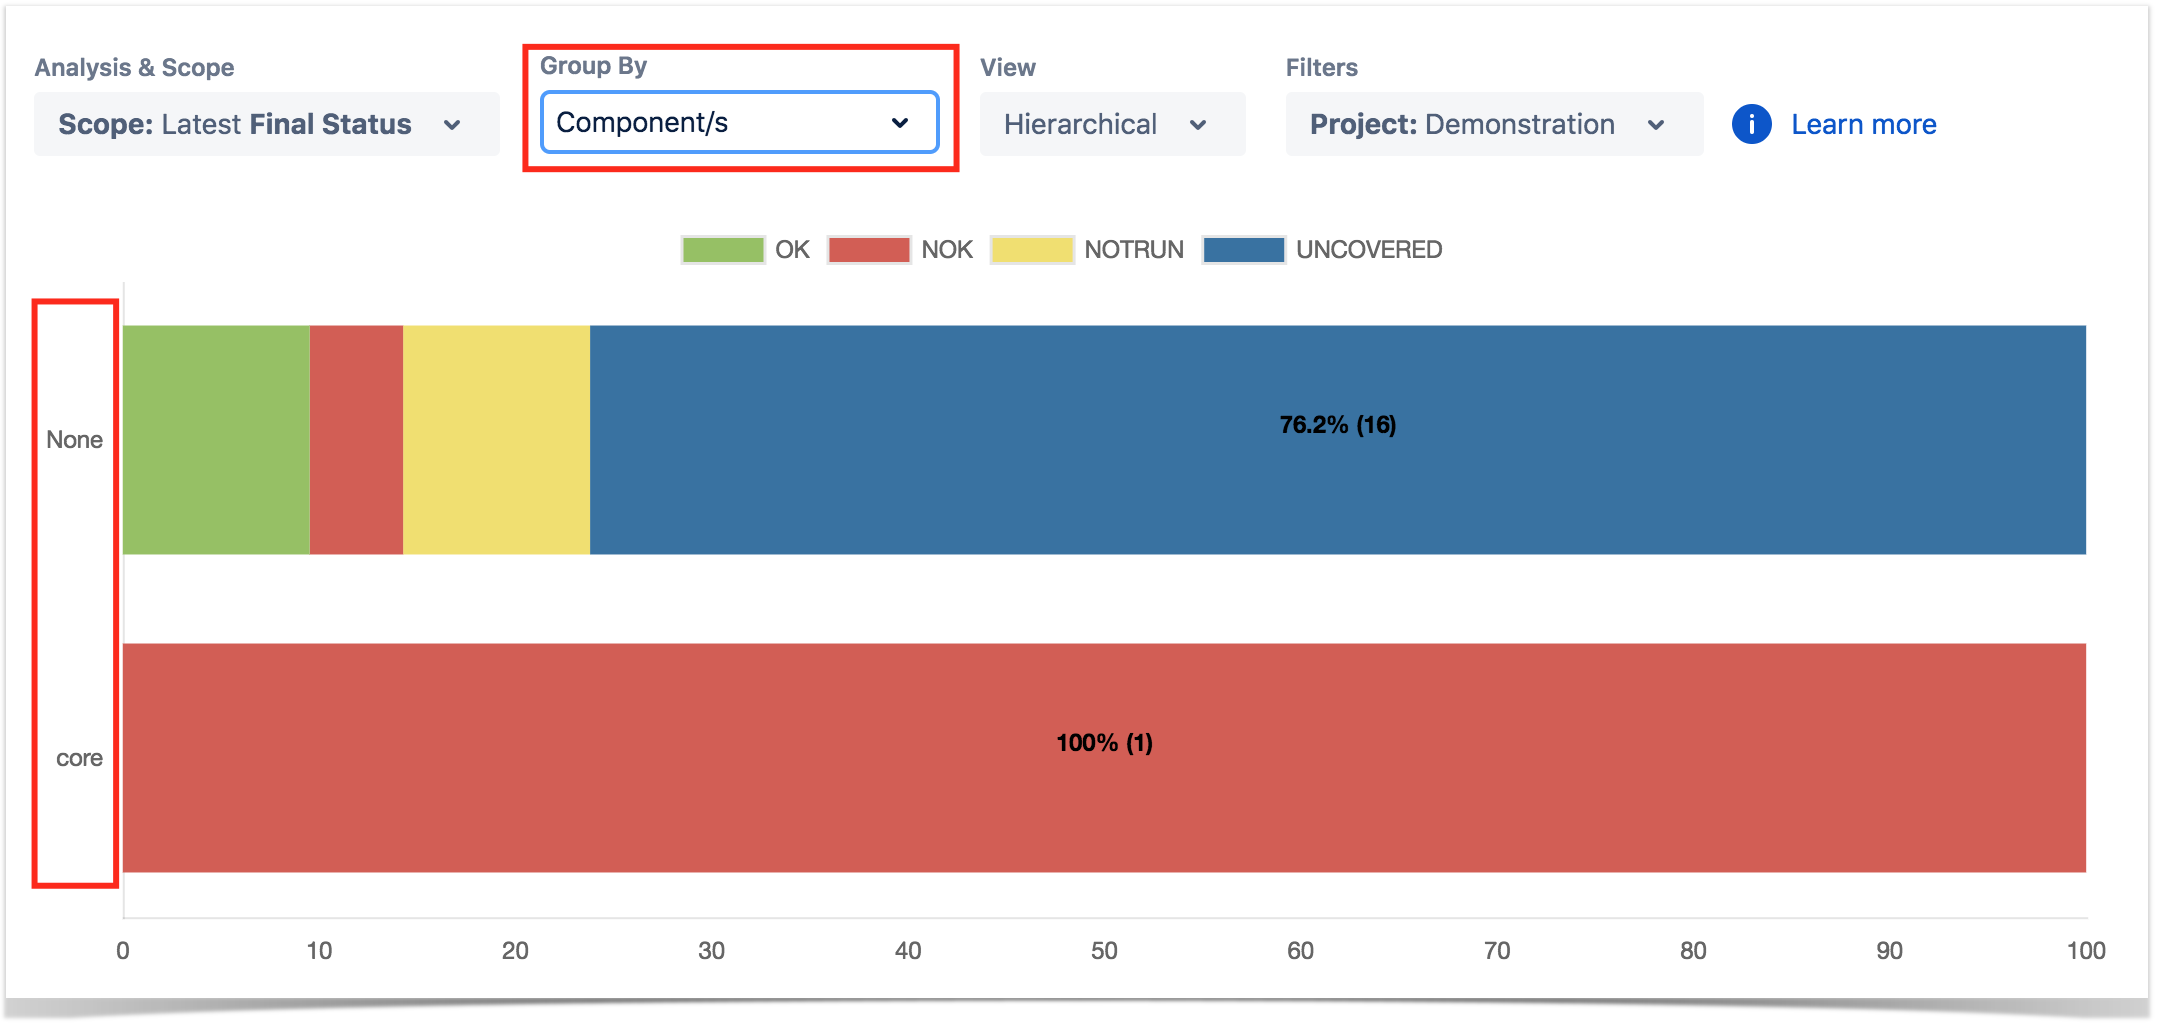
- Group By: how to visually group the coverable issues (e.g. by prioriy priority, by component);
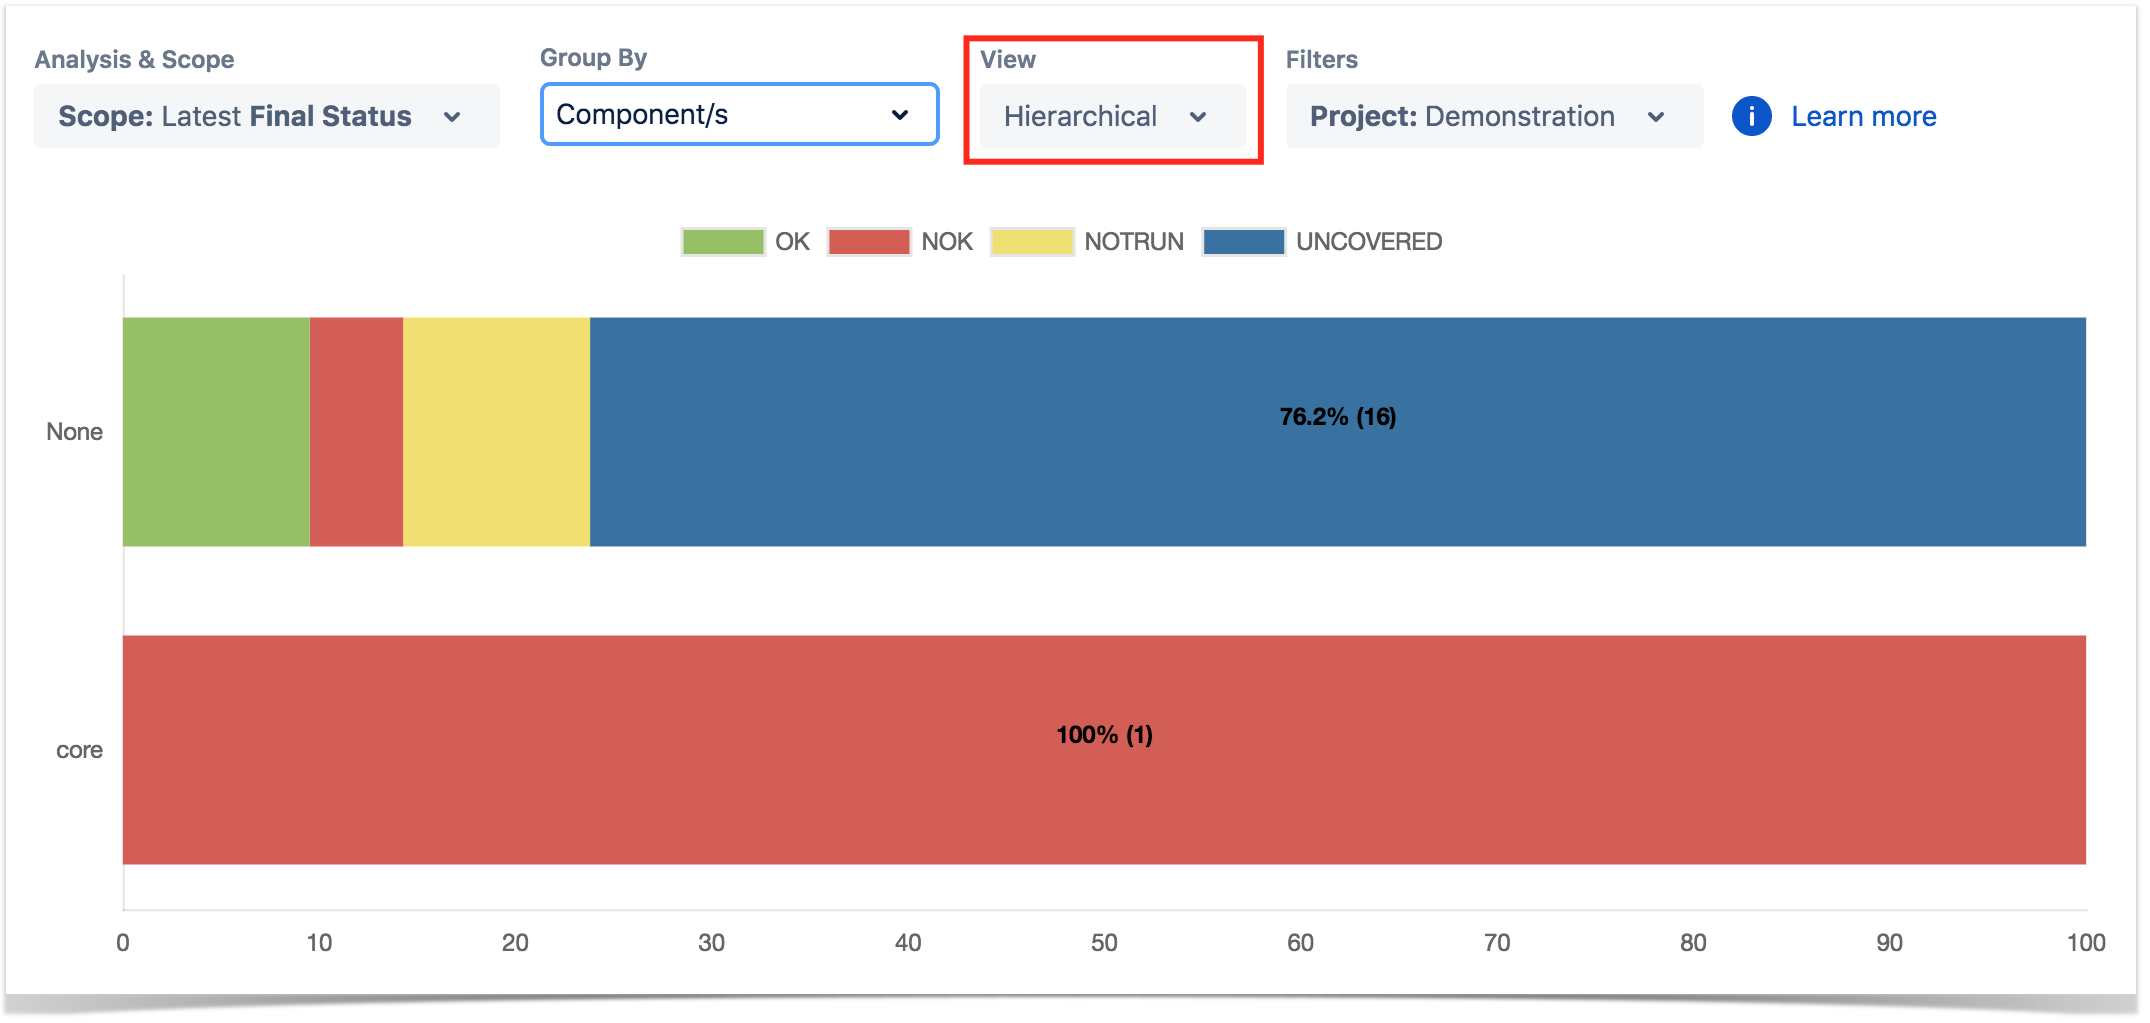
- View: flat ot hierarchicalor hierarchical;
- Filters: the source data for the report (e.g. the requirements or other covered issues) and how to evaluate the status for each one of the item being shown.
Source data/Filters
The source data for the report (e.g., the requirements or other covered issues) can be defined under Filters, which available at the top left-hand corner.
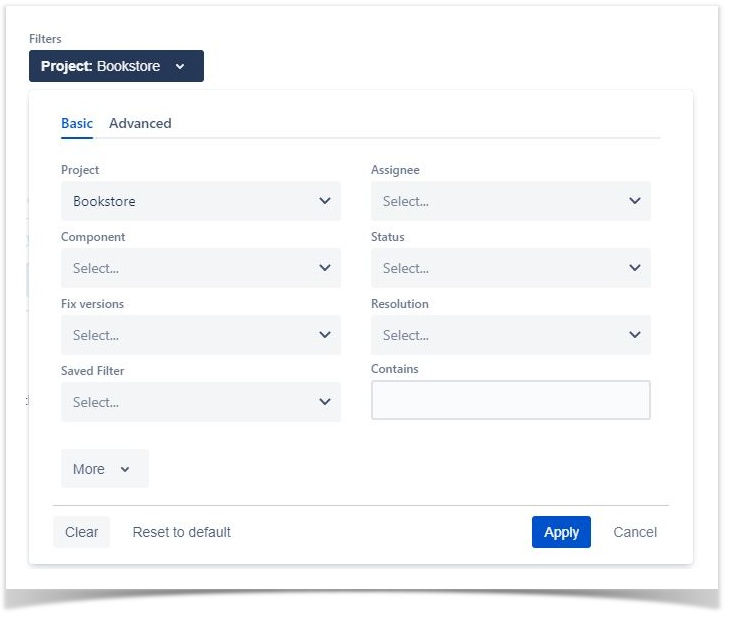
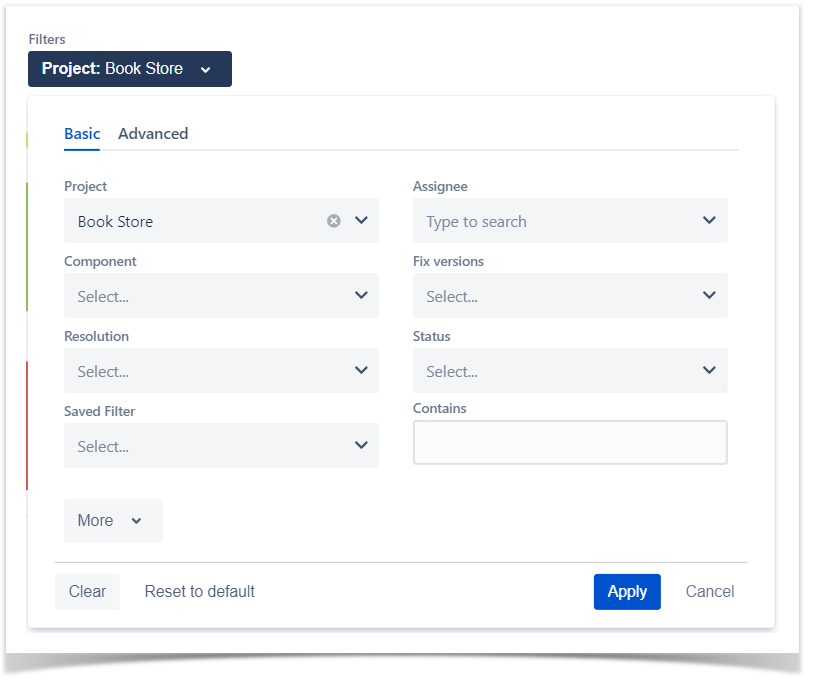
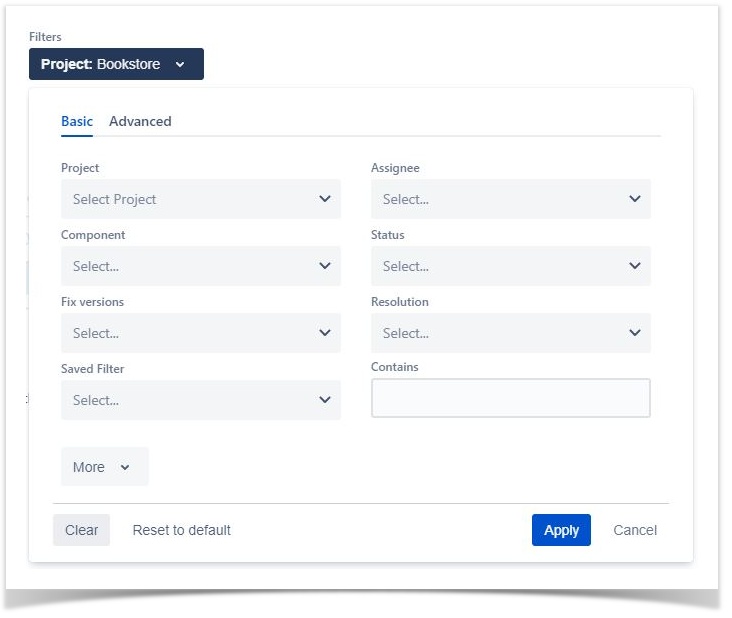
Source "requirement"/coverable issues can be directly provided using a Basic or Advanced filter:
- Advanced: a JQL query to filter the coverable issues.
- Basic:
- Project: project;
- Assignee: the issue's assignee;
- Component: the component assigned to the issue;
- Fix Versions: versions assigned to the issue;
- Resolution: the workflow resolution;
- Status: the workflow status;
- Saved Filter: a saved filter;
- Contains: the full issue key or part of the summary.
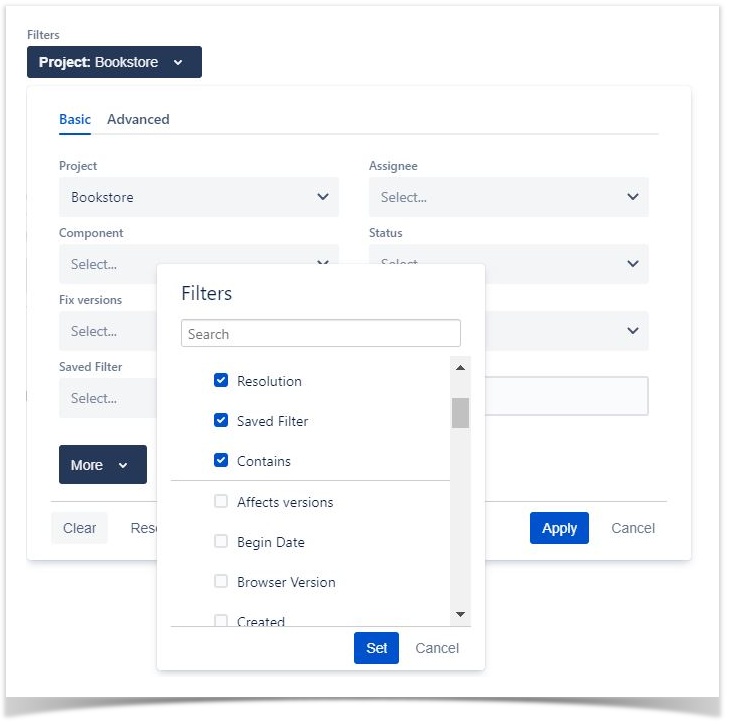
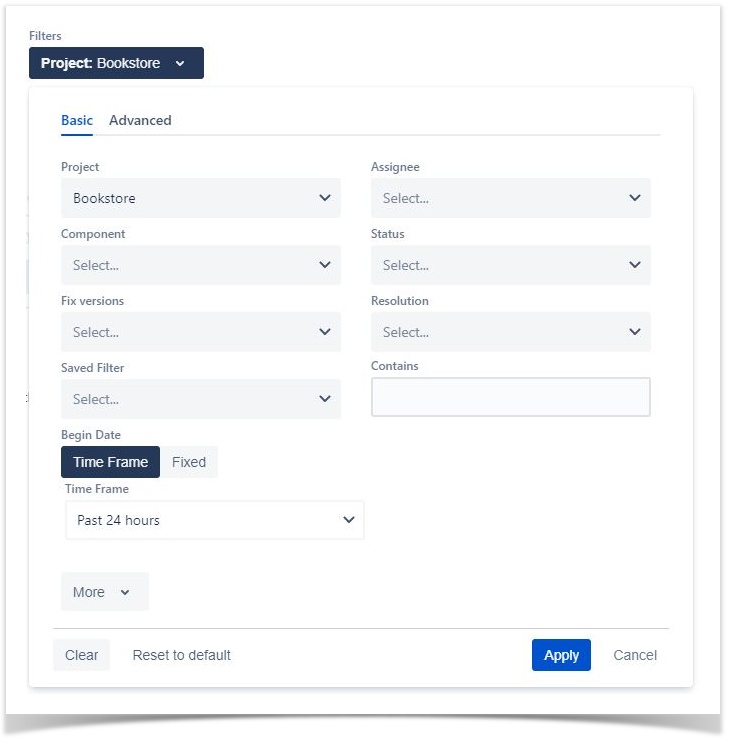
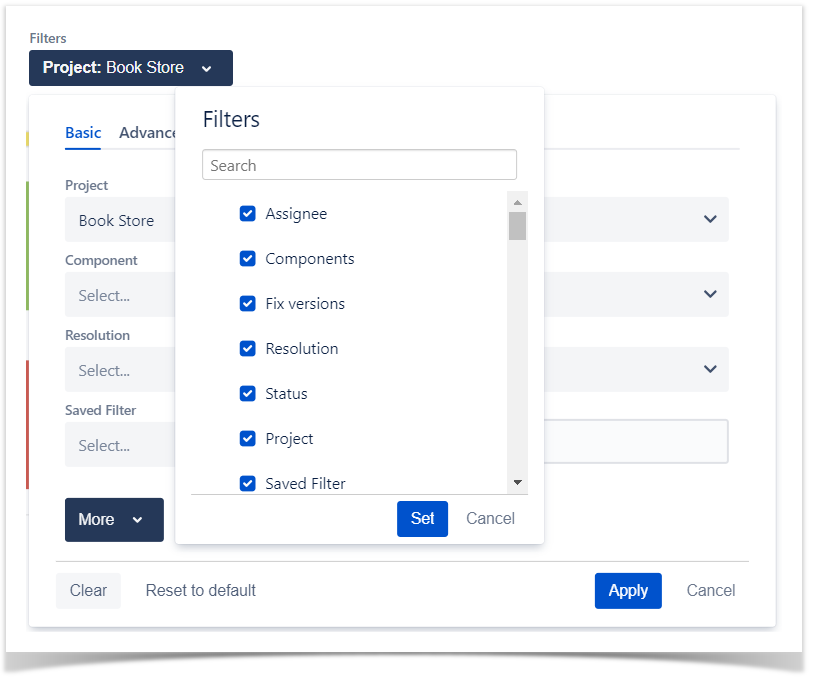
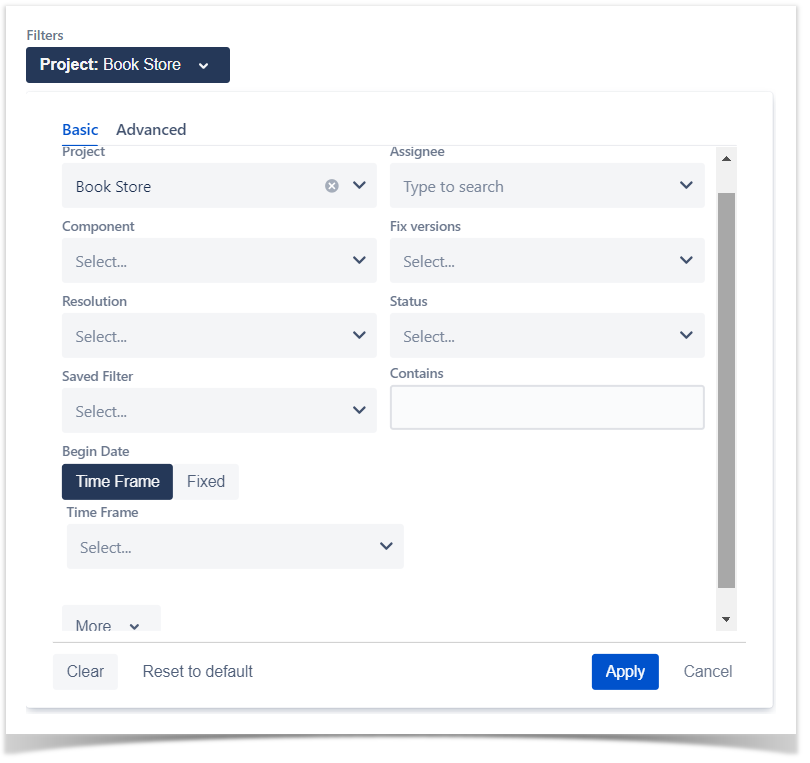
To add more more fields to the filter you can click thethe "More" More button.
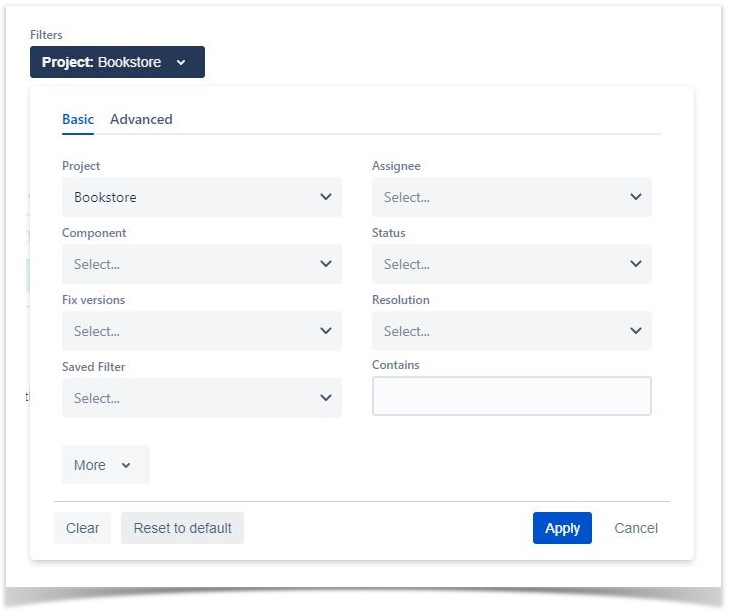
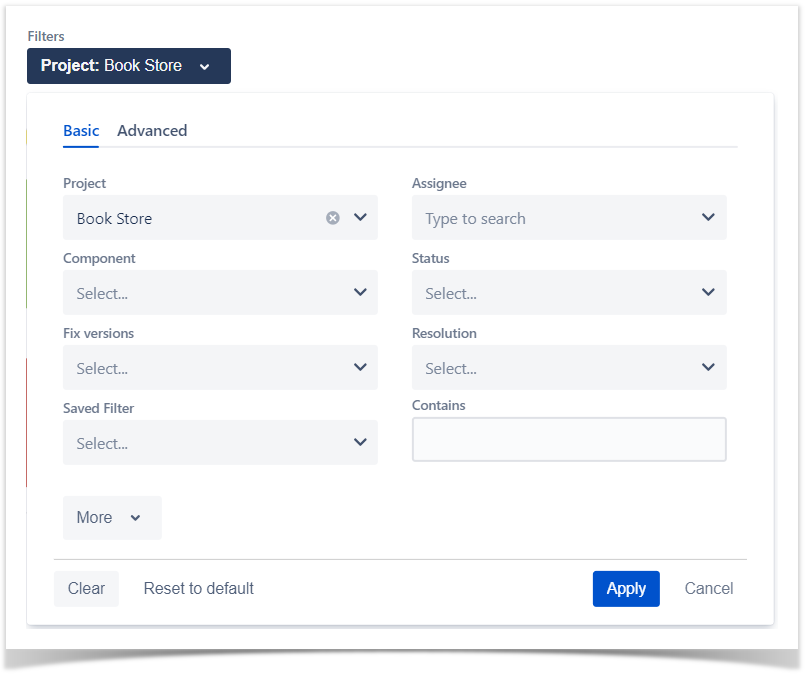
If you want, you can reset the filters that are displayed back to the default filters, or you can clear all the filter values.

Analysis & Scope
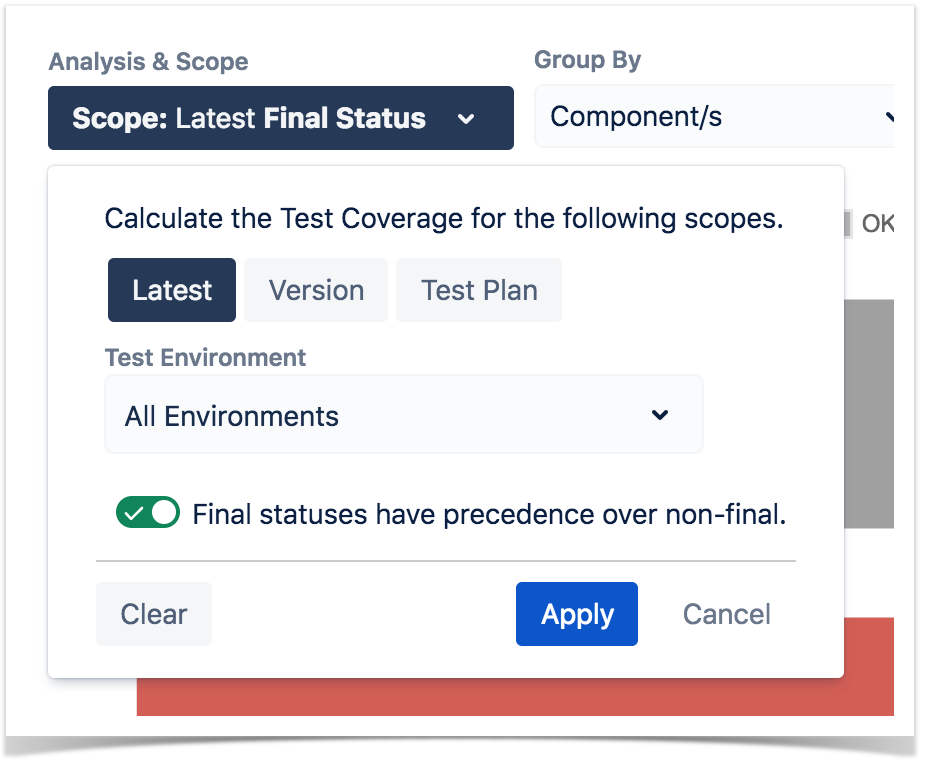
On the left side, you can define the analysis strategy, i.e., the way you want to analyze the selected/filtered requirements. You can choose either to analyze by by Latest, Version or Test Plan, and then complement it with a Test Environment.
If you choose analysis by by:
- Latest, then the latest results from Test Executions are taken into account;
- Version, then the latest results from Test Executions for the specified version are taken into account
...
- ;
- Test Plan, then only Test Executions (and related results) associated with the given Test Plan are considered during the calculation of the requirement status.
If you specify the Test Environment, then only the executions that ran in the specified environment are considered.
| Info | ||
|---|---|---|
| ||
Please read Coverage Analysis for a more detailed explanation of how to perform coverage analysis. |
...
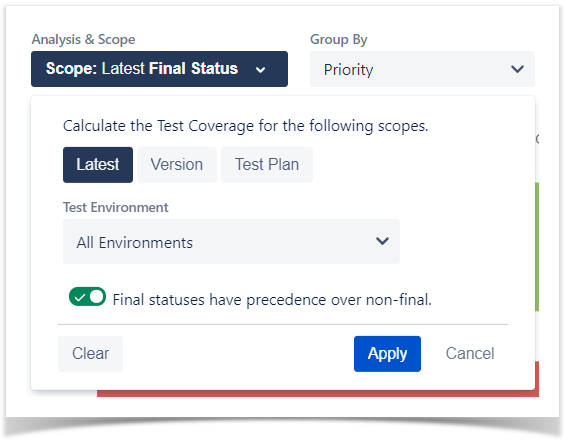
You can visually group the requirements by Priority, Component or other fields, so you can analyze requirements from different perspectives.
| Section | ||||||||||
|---|---|---|---|---|---|---|---|---|---|---|
|
| Info | ||
|---|---|---|
| ||
For more information, please see the Coverage Analysis. |
...
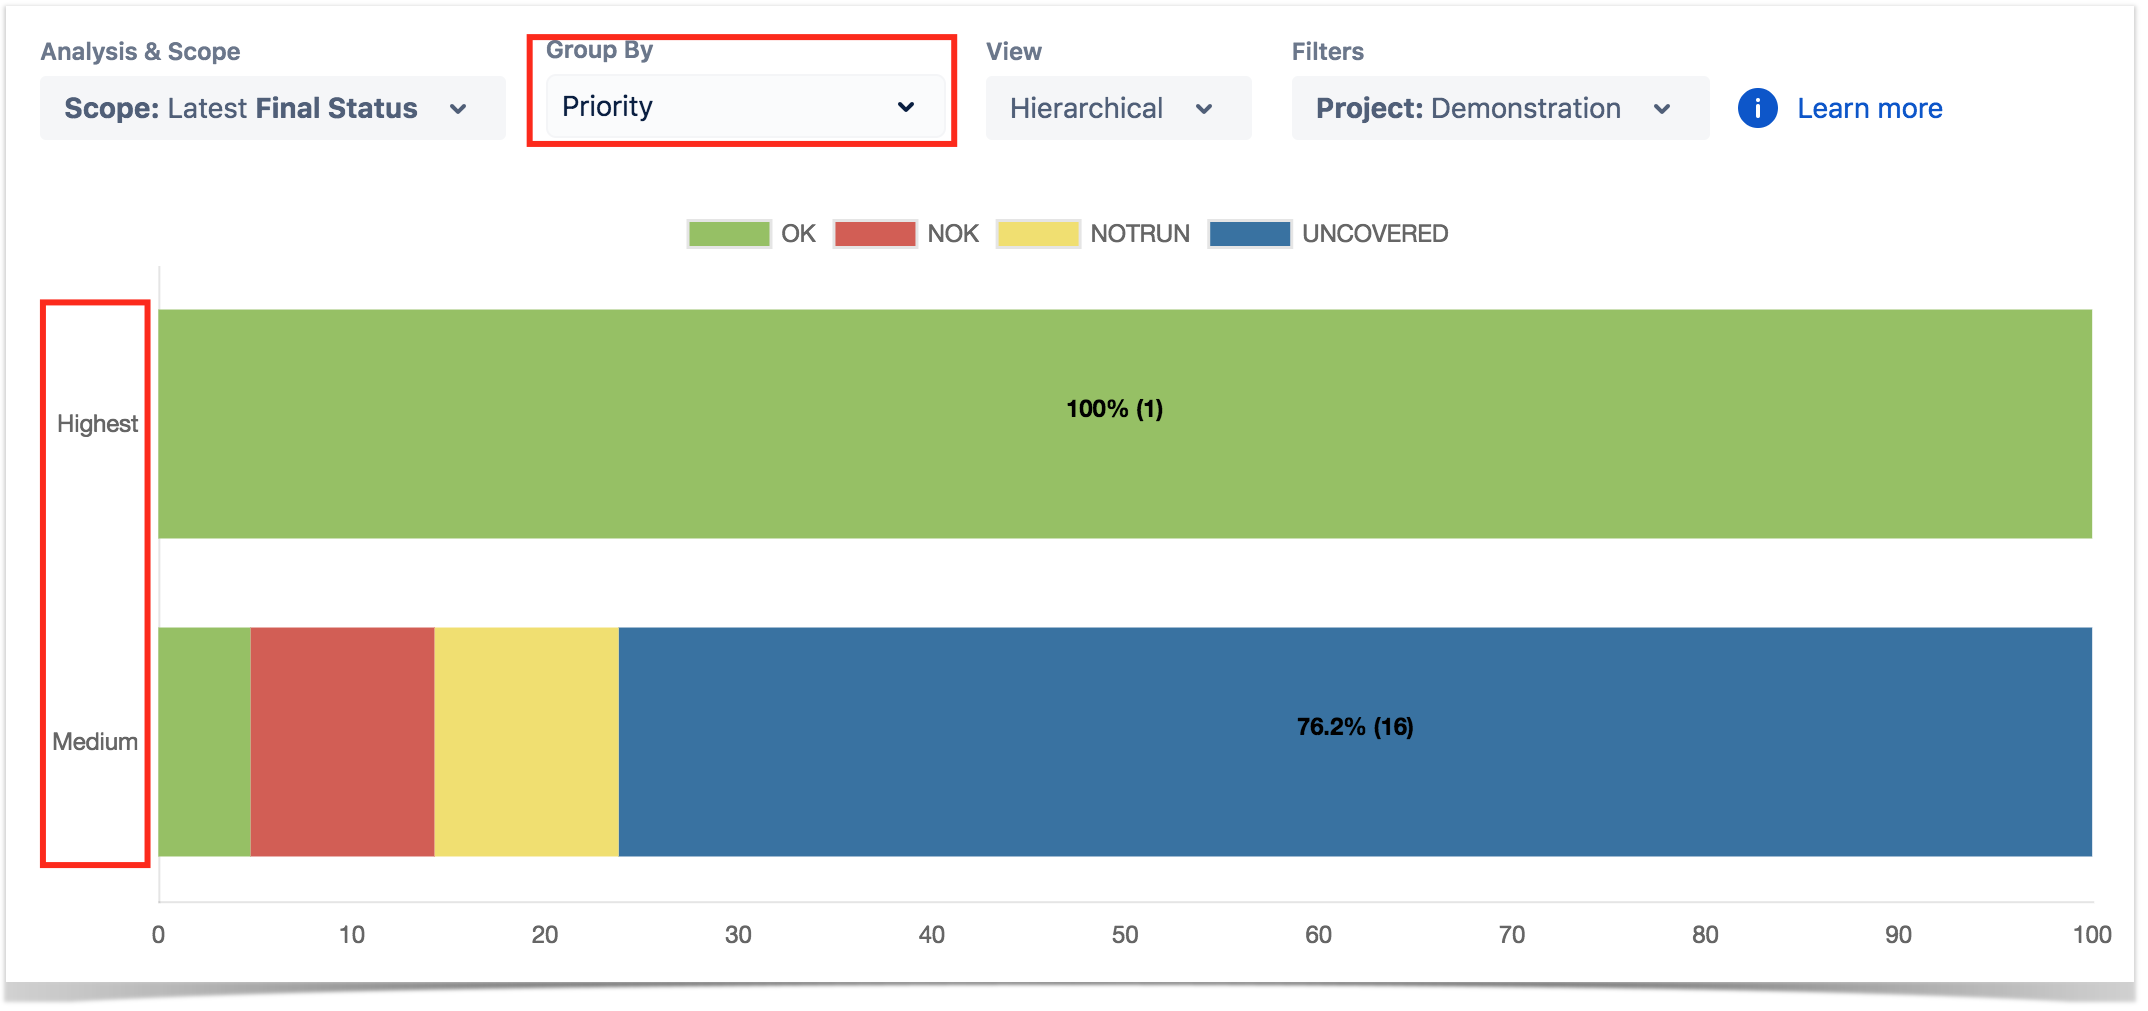
For example, if you're using Epics and Stories and you choose the "Flat" view, then only the Epics will Epics and related/linked Stories appear in the report, independent of whether the source data includes the sub-issues or not. If you choose the "Hierarchical" view, then only the Epics would be shown.
- Hierarchical - only the parent coverable issues will be presented in the chart. Child issues can still be visualized in the overall details table.;
- Flat - the parent/child relationship between coverable issues is not considered. All parent and child issues will be considered for the chart.
Example
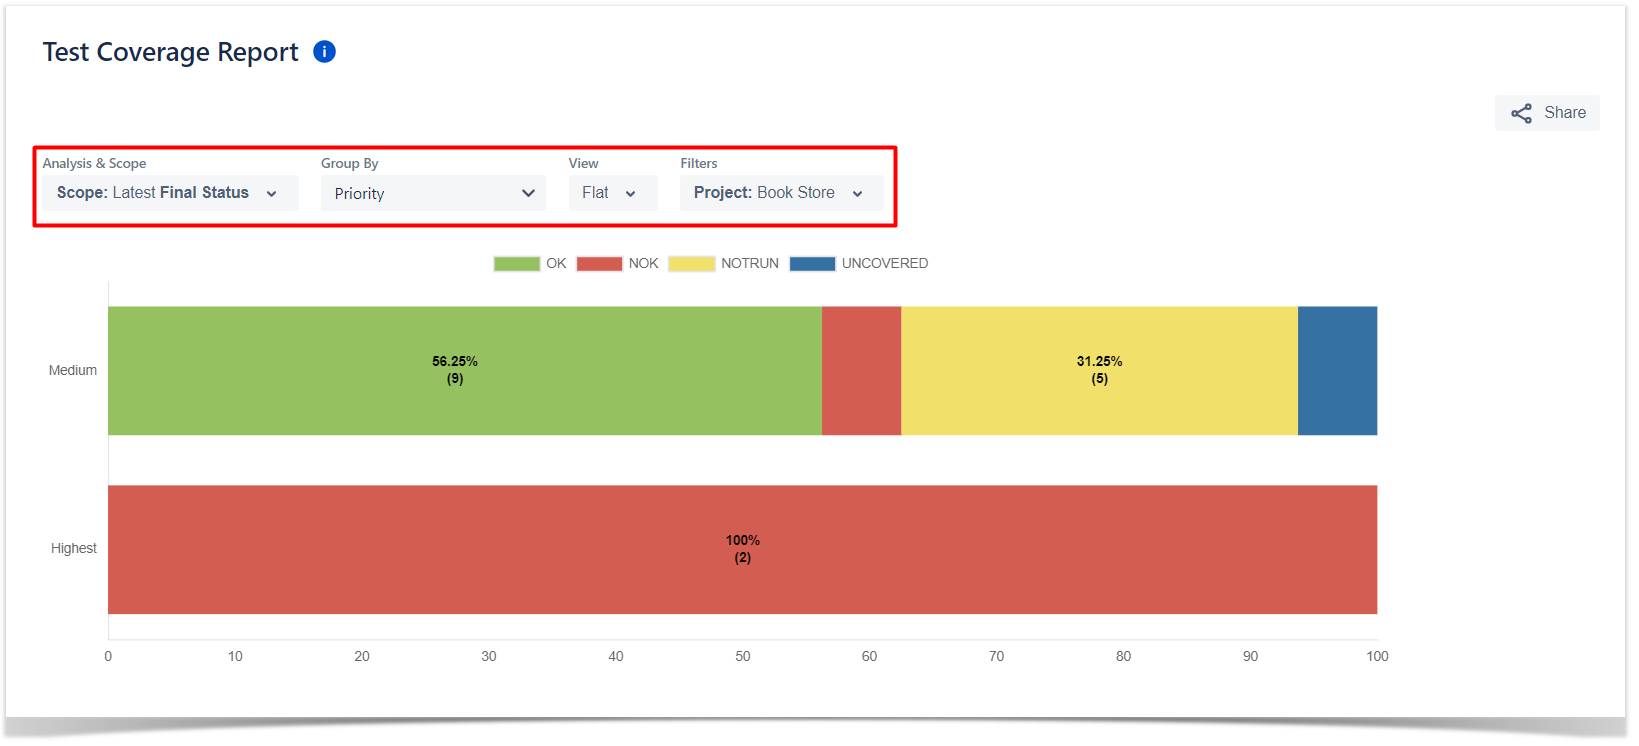
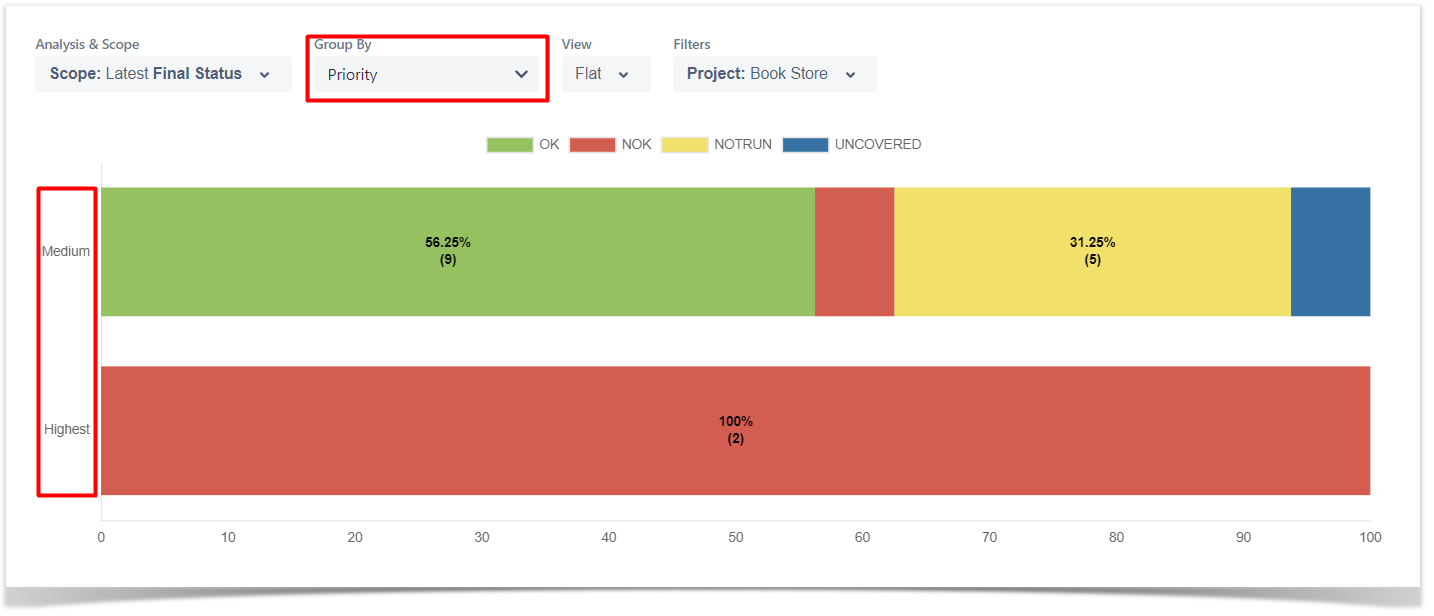
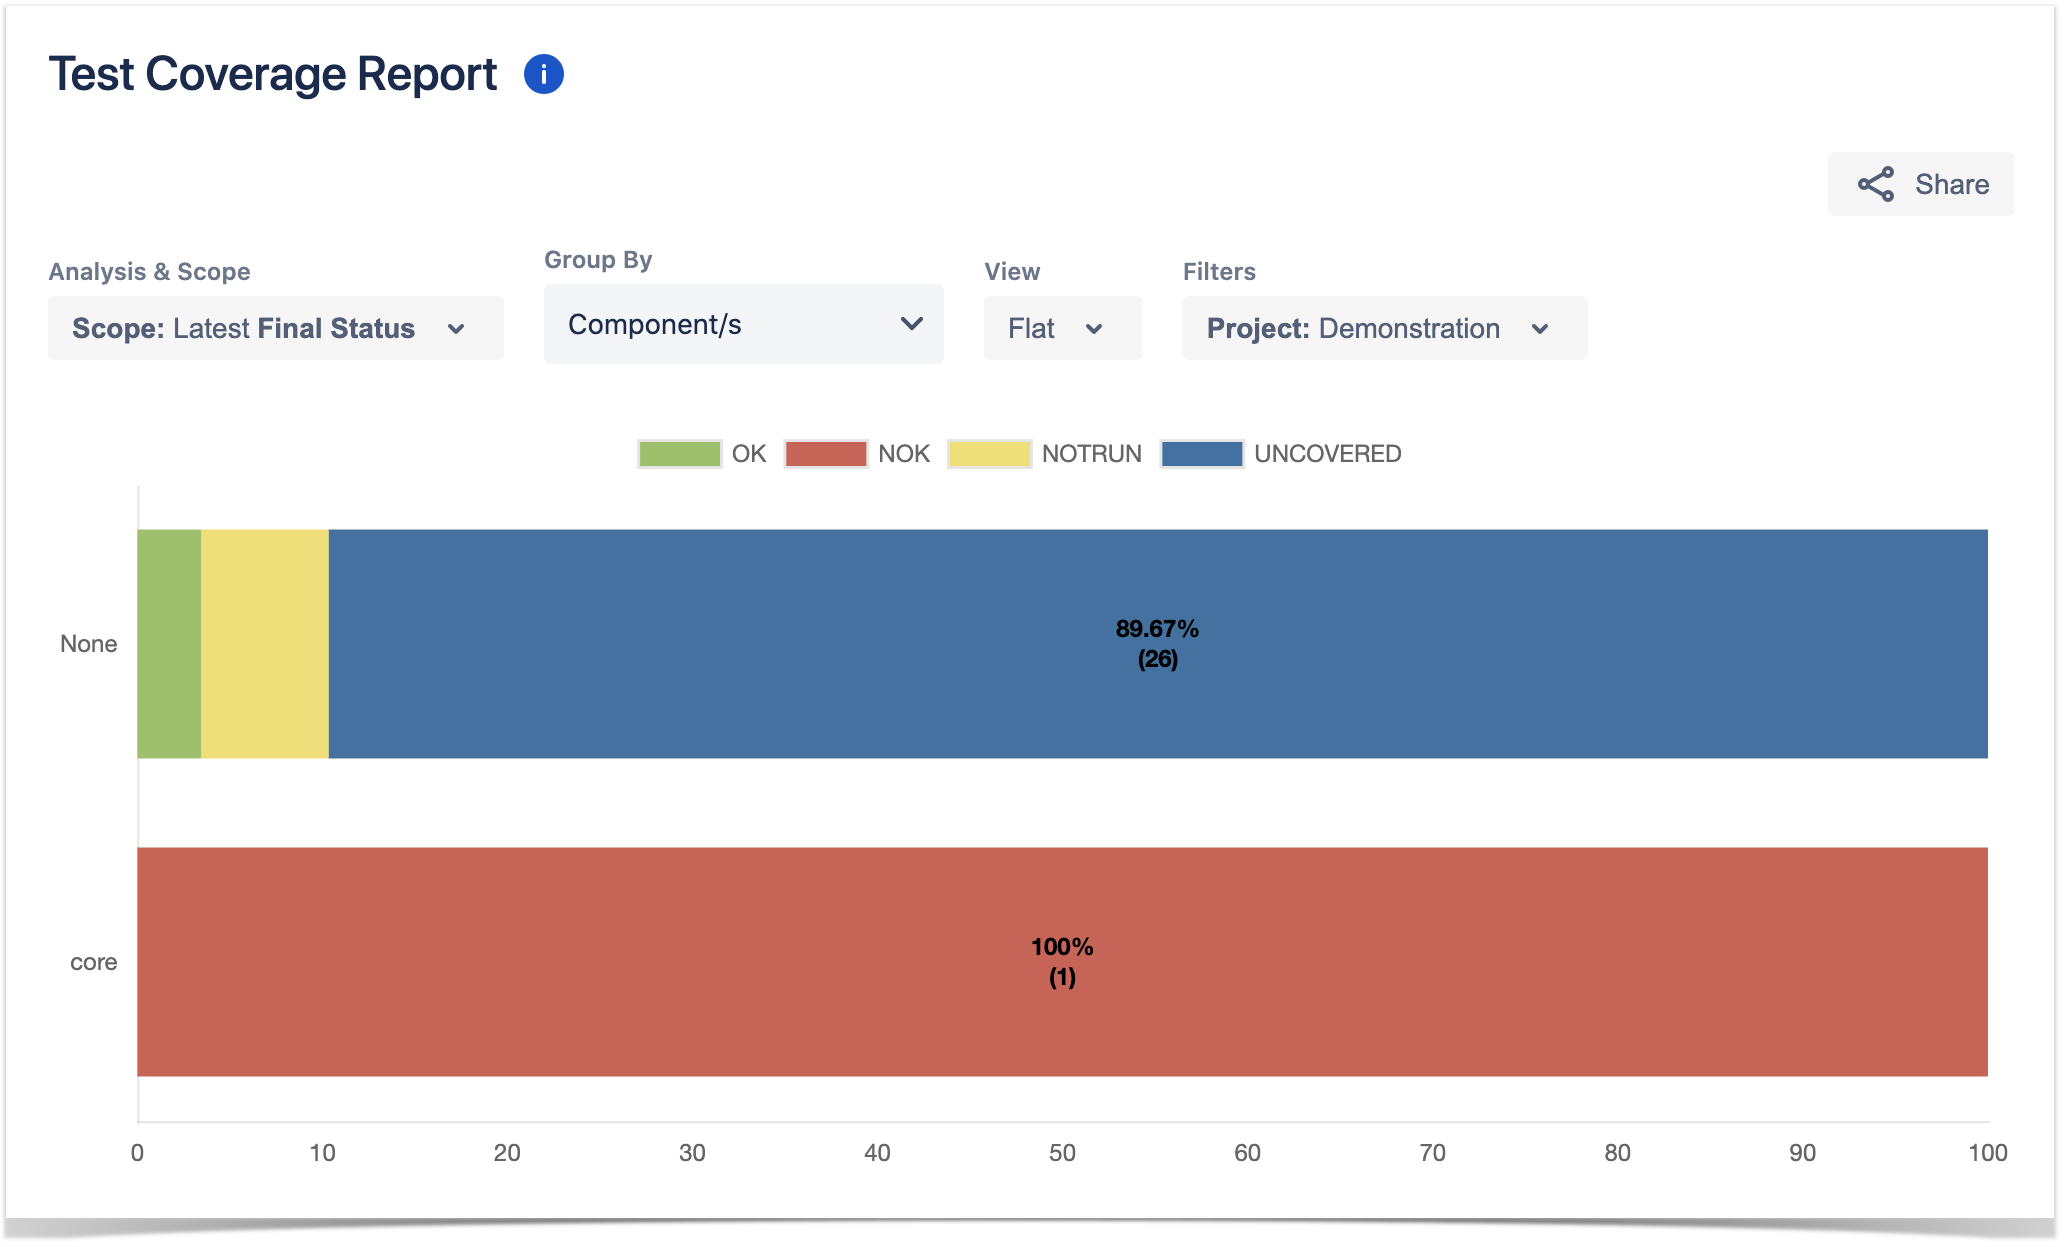
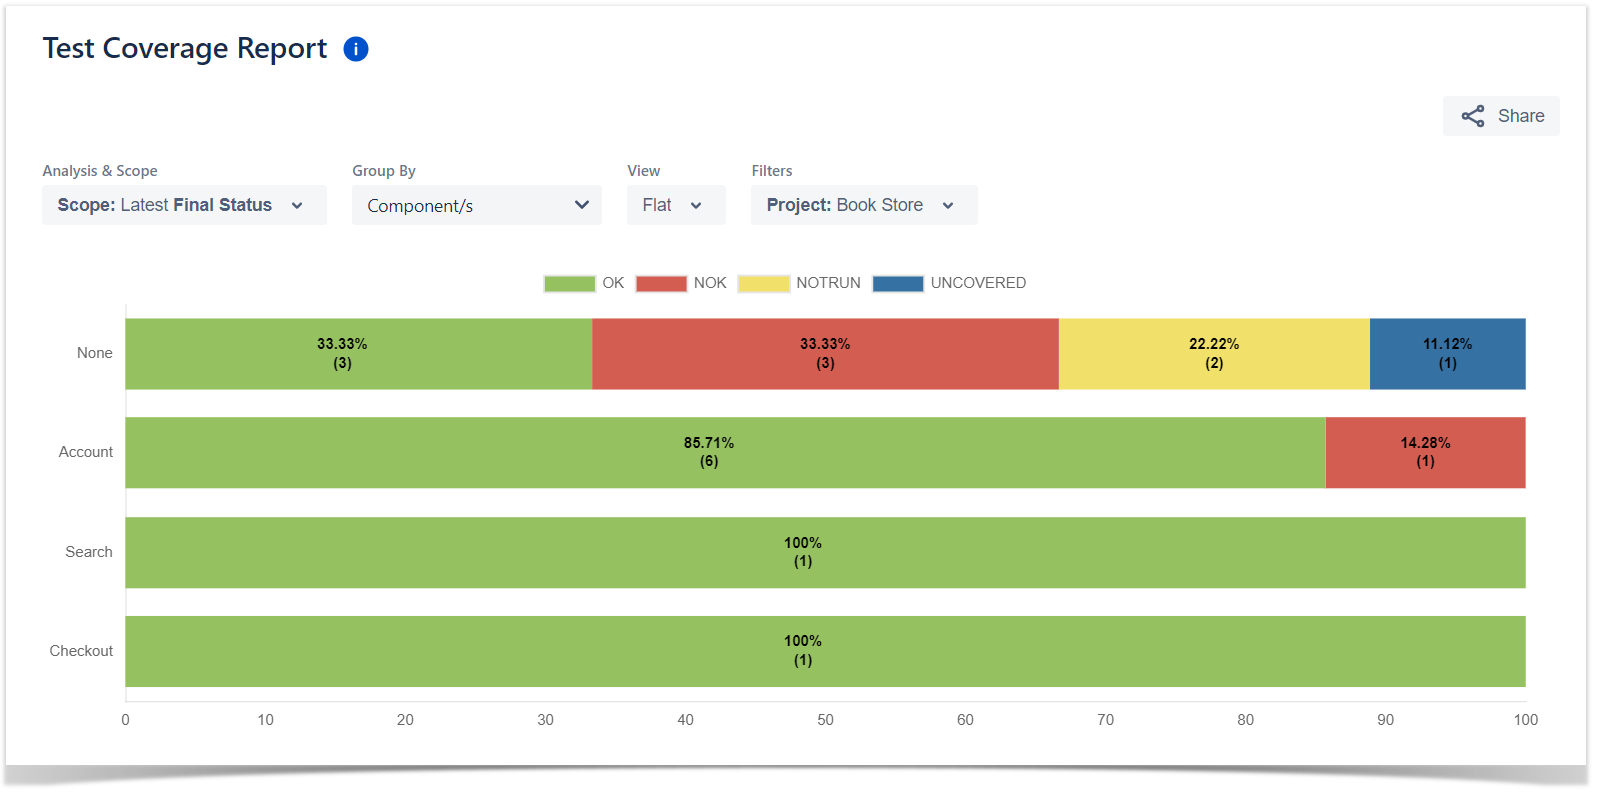
Each bar on the chart represents a group of Requirements with a different value provided by the grouping field. Stacked within each bar are the Requirements grouped by coverage status: OK, NOK, NOT RUN, UNKNOWN and & UNCOVERED.
Because this is a normalized chart, the bars are always 100% wide.
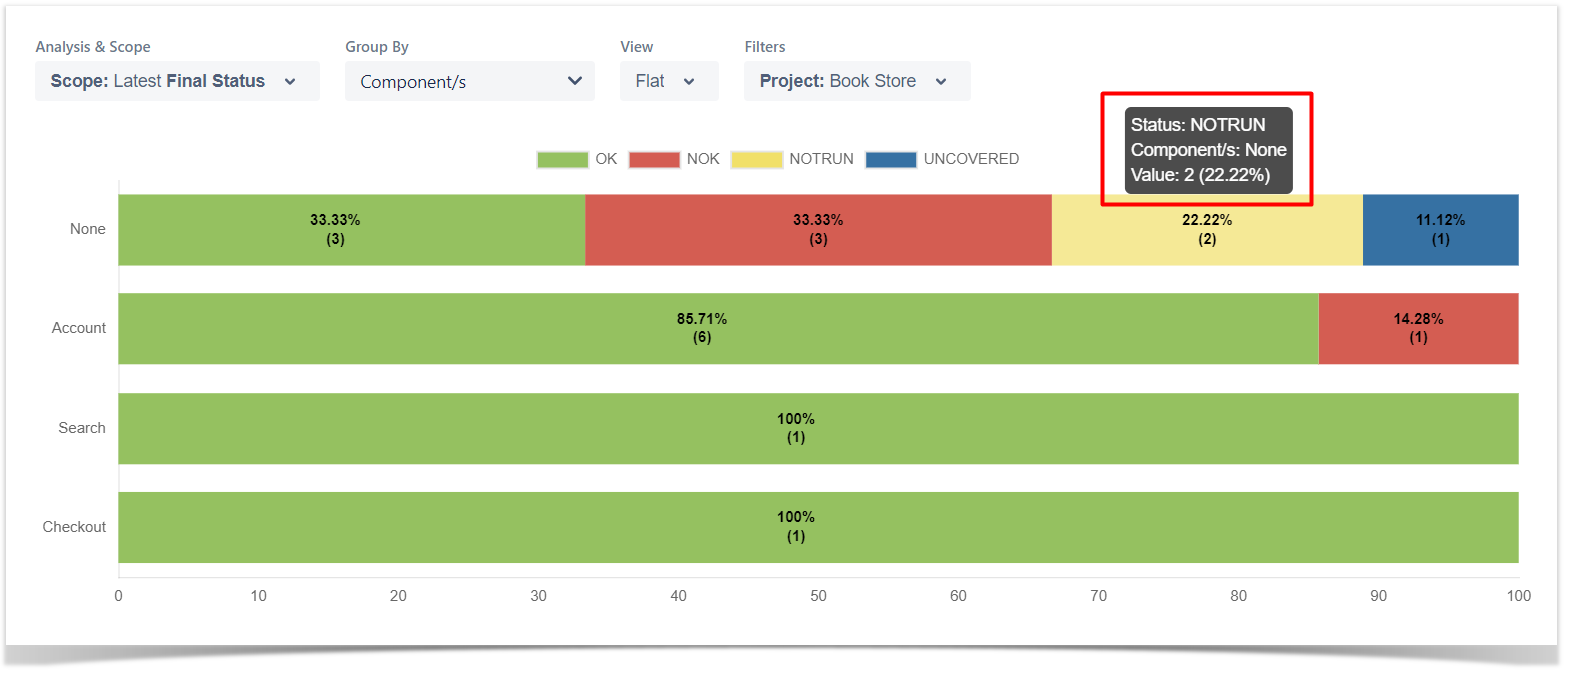
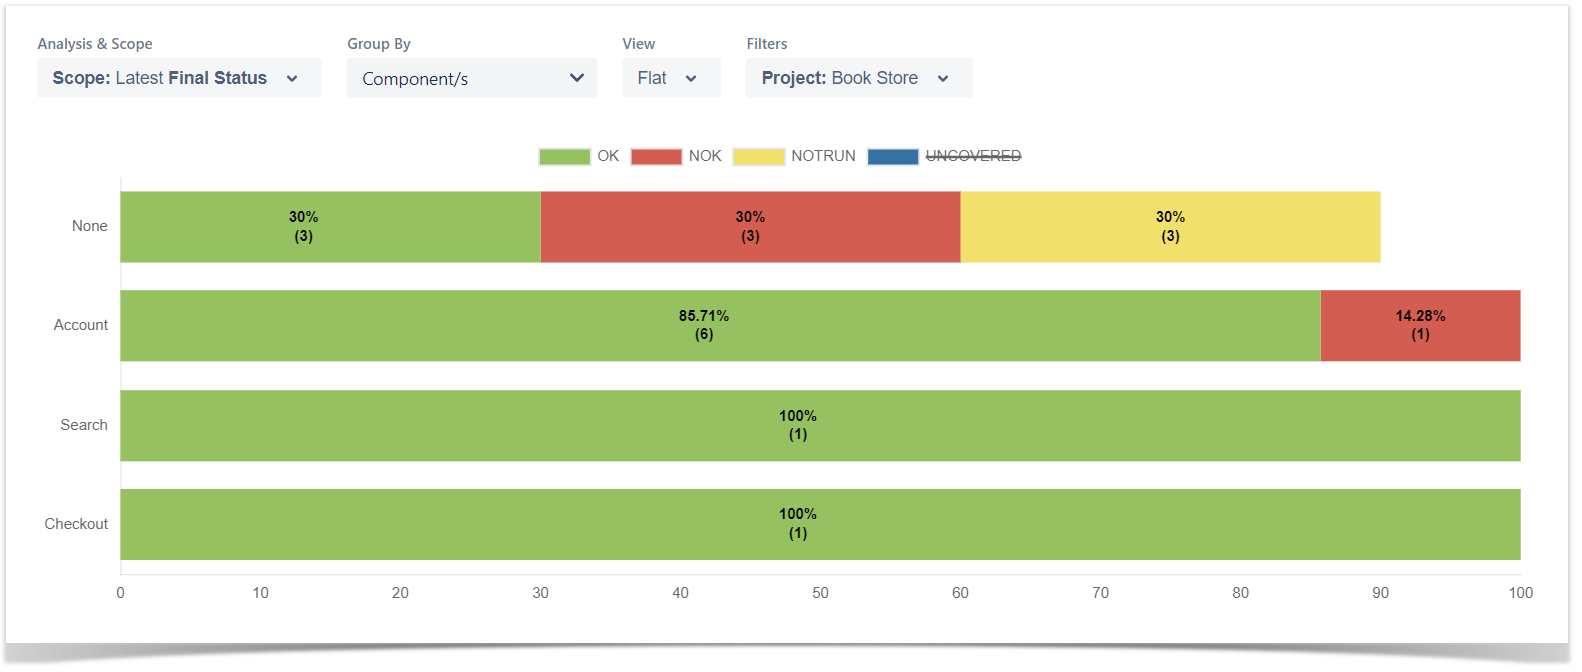
The Overall Coverage requirements chart is interactive. Hovering over each bar shows a small popup with the information on the specific series (Status, Grouping Field and Percentage). You can can deactivate a particular series by clicking it in the series legend.
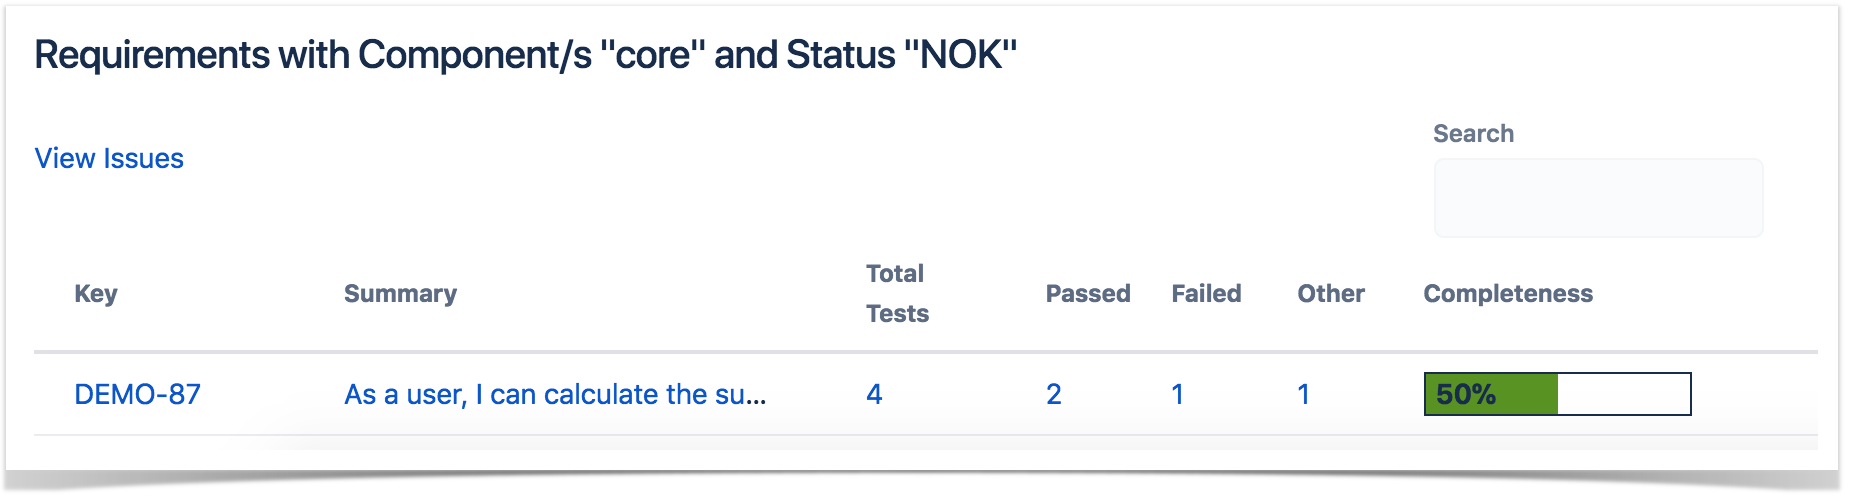
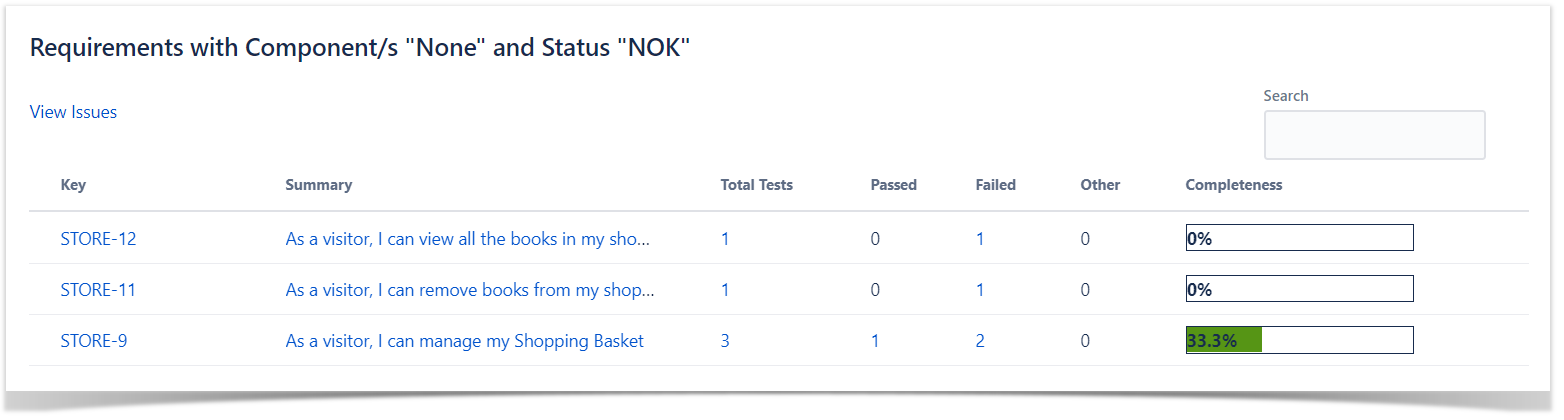
The chart also supports drill-down. When a section is selected, a table appears below the chart with the Requirement issues.
...
- Total Tests: total number of linked tests;
- PassedPASSED: total number of tests passing (i.e., the ones whose status is mapped to the Test Coverage status "OK") ;
- FailedFAILED: total number of tests failing (i.e., the ones whose status is mapped to the Test Coverage status "NOK") ;
- Other: total number of tests whose current status is mapped to the Test Coverage statuses "Not Run" or "Unknown";
It also contains a column with a progress bar that shows the completeness of each issue.
Some values may provide a link, so you can be redirected to the respective entities corresponding to the number shown.
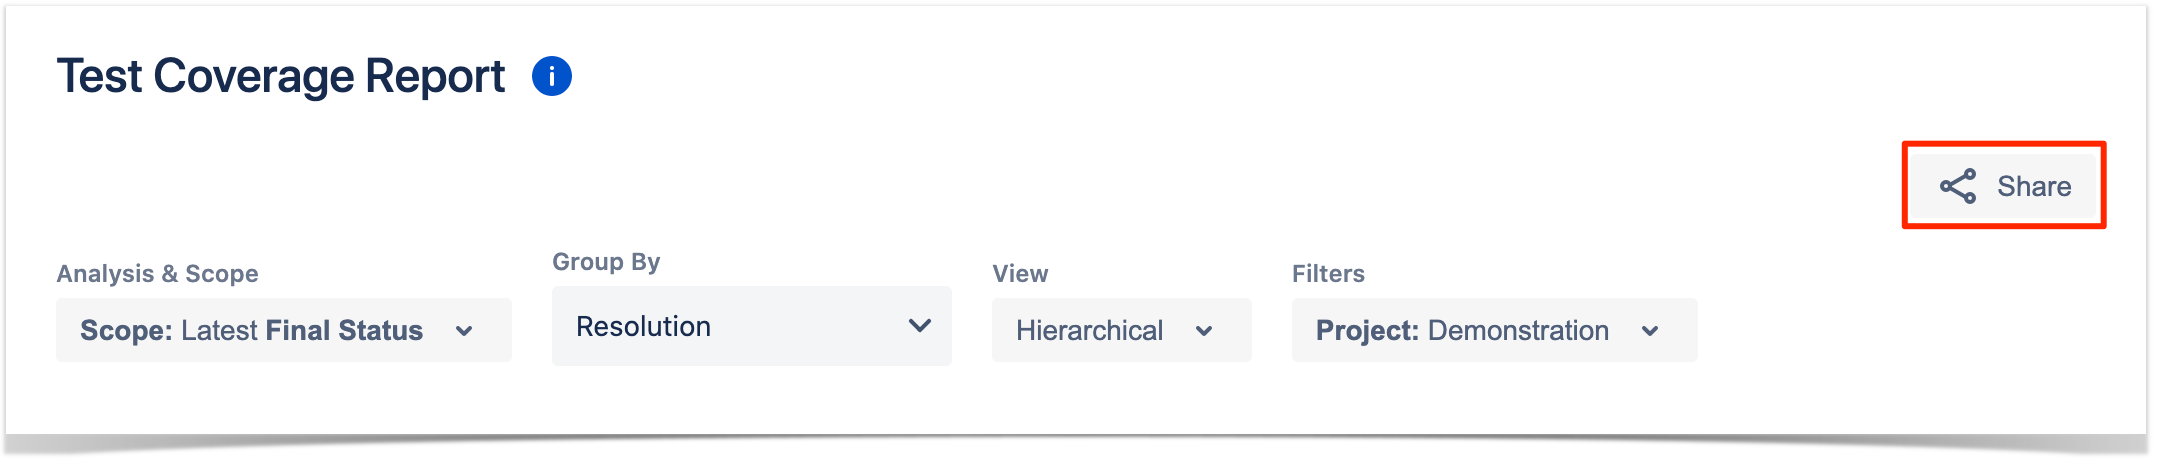
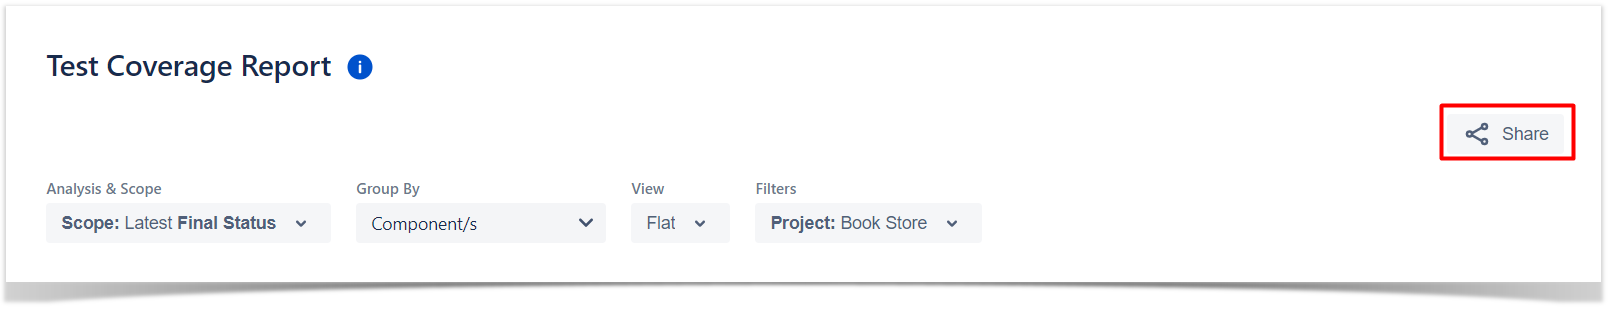
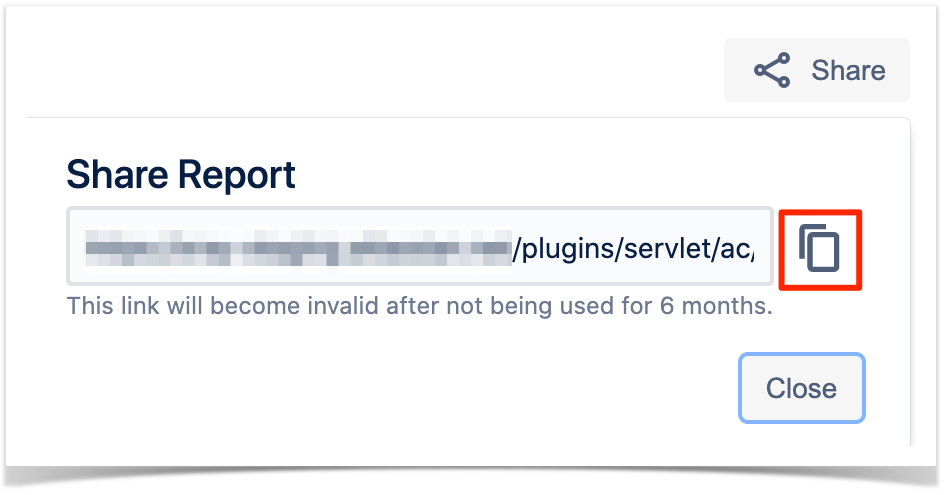
Share
To share the report click the Share button and then click the copy icon to copy the link to clipboard after this you can send the link to other users who can then view the report with the same filters. This link will be deleted if it's not use used for more than 6 months.