Page History
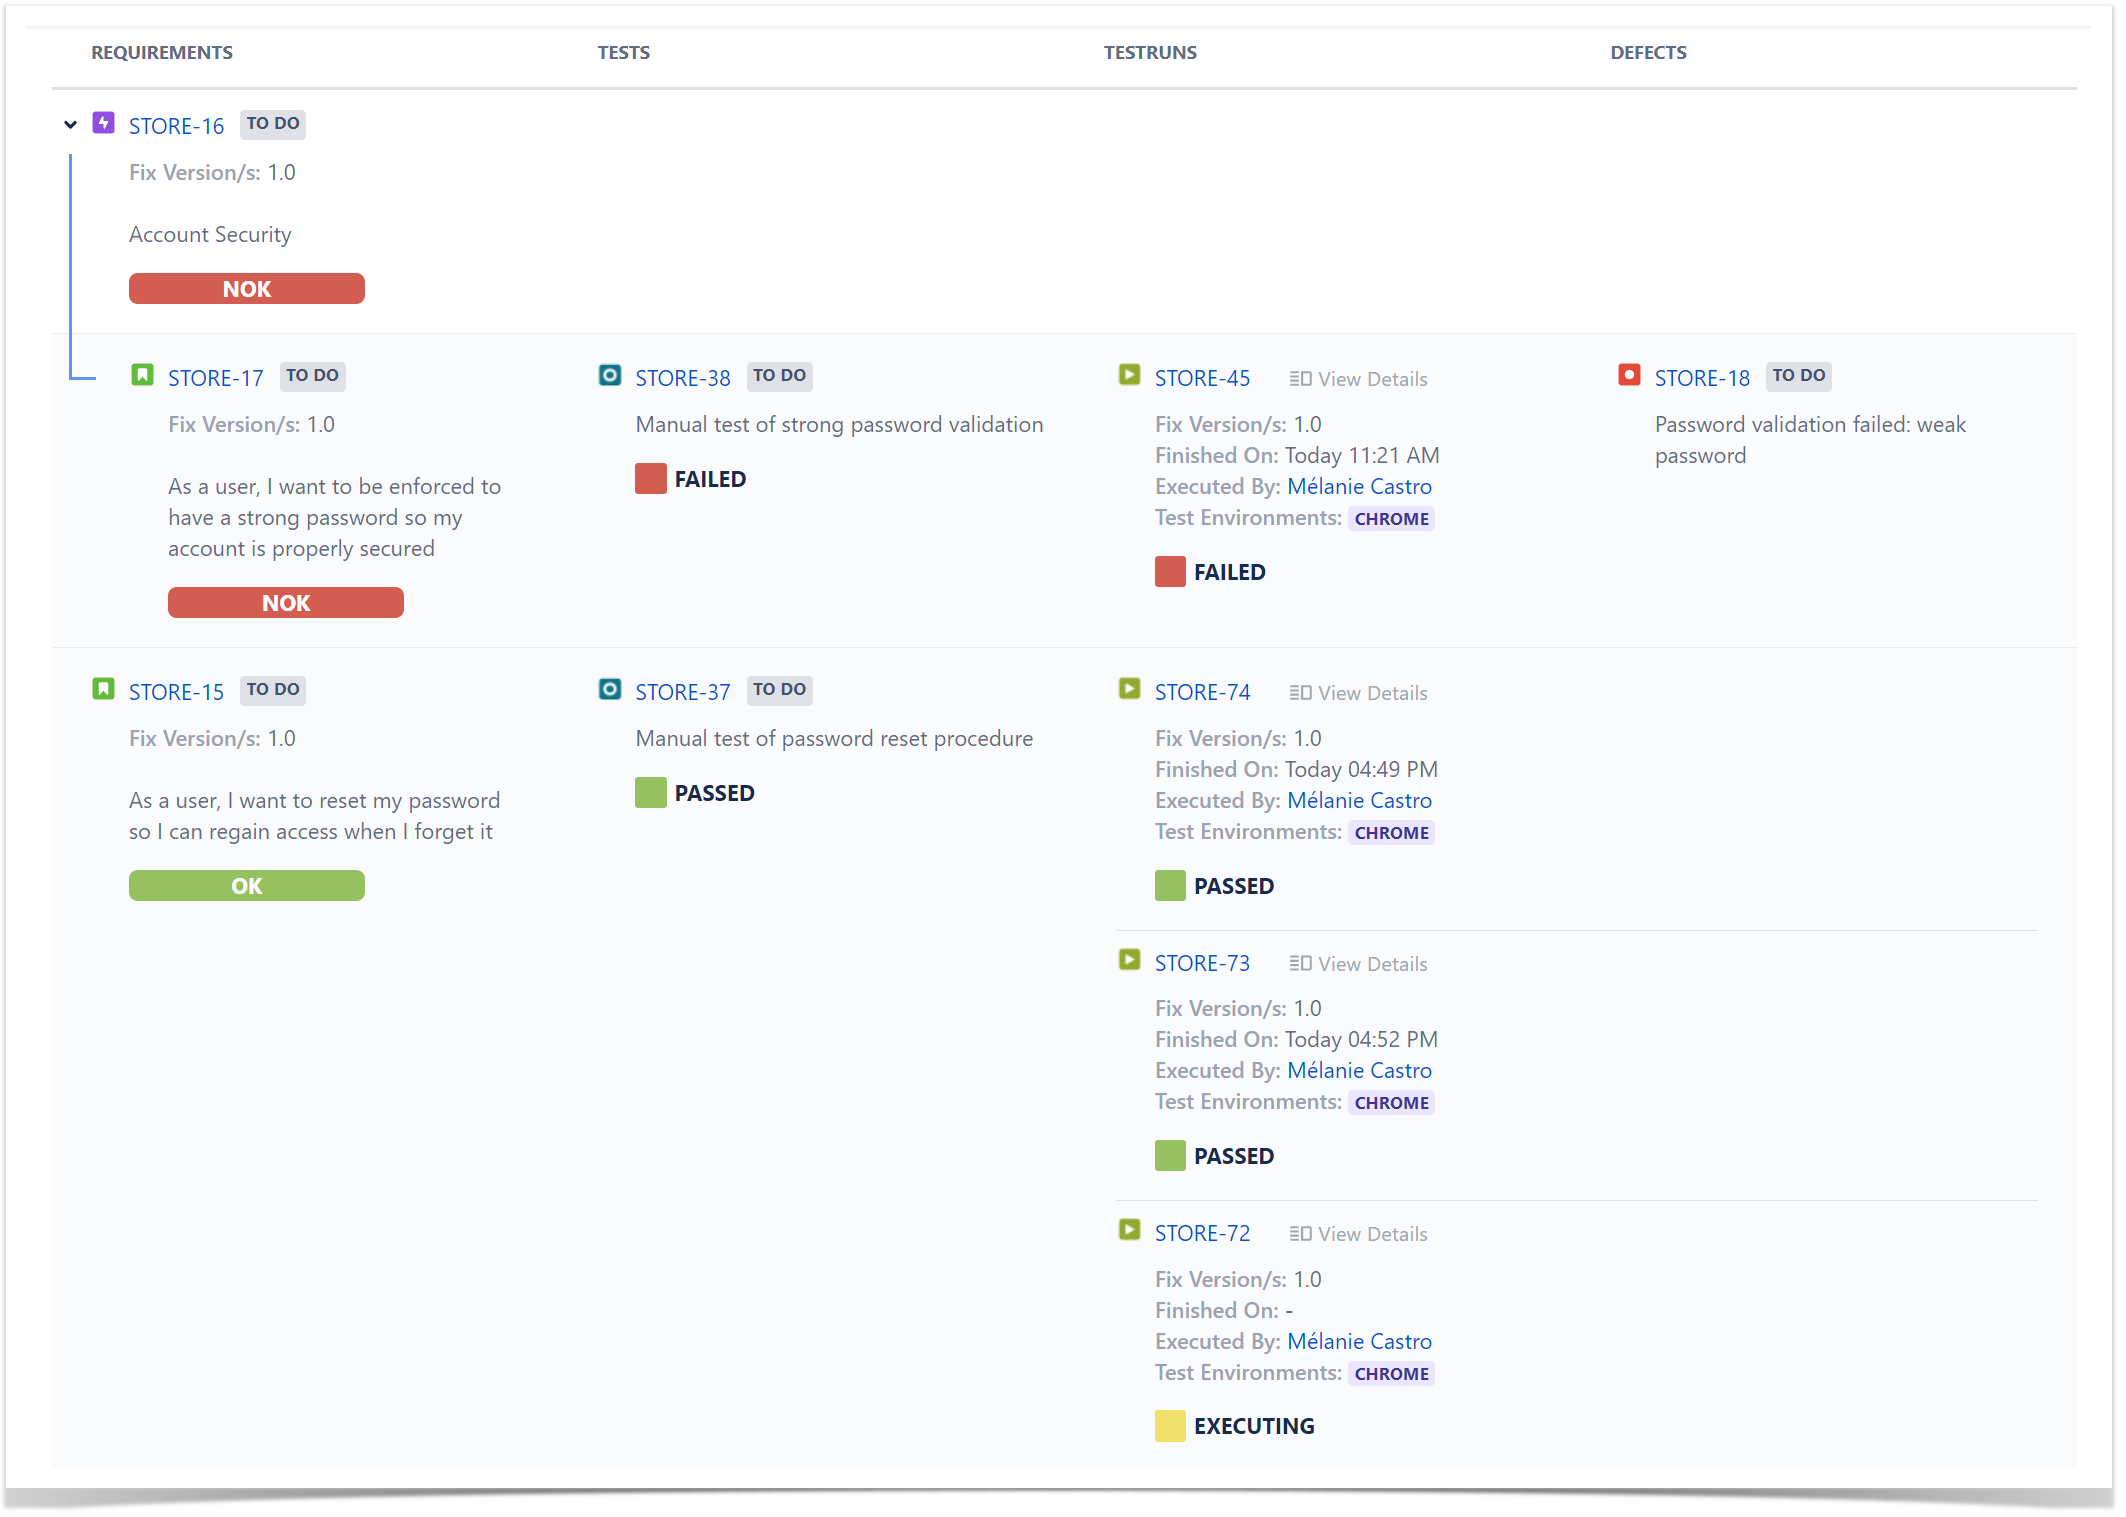
Shows the requirements traceability through tests, test runs and defects.
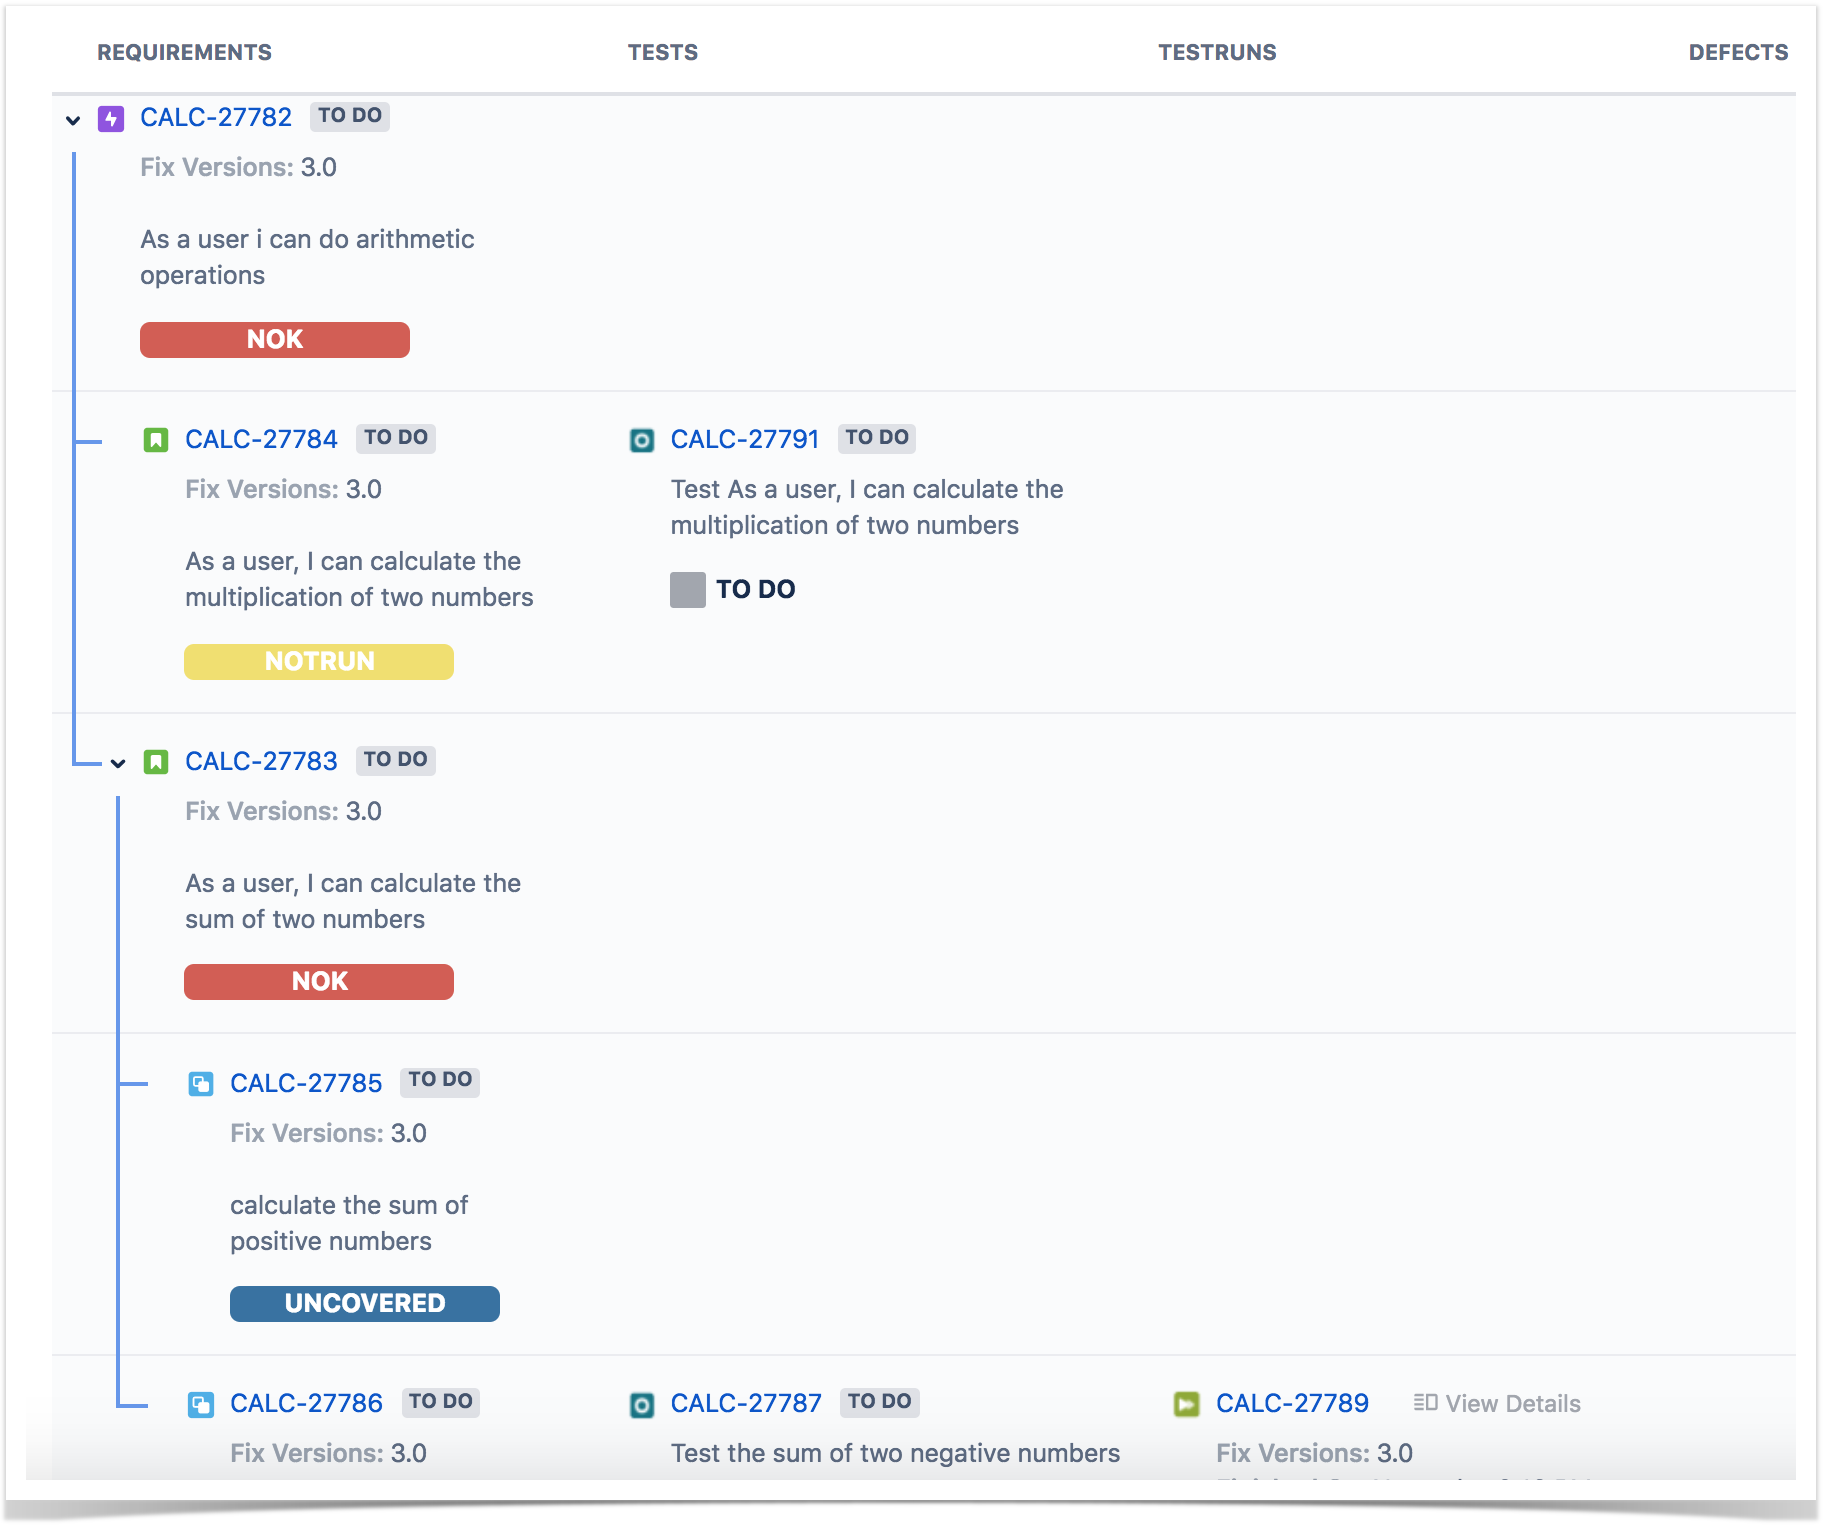
It supports 3 level for requirements (e.g. epicEpic =>stories> Stories =>sub> Sub-tasks), allowing you to track the coverage at multiple levels.
...
Possible usage scenarios:
- make full traceabiliy Make full traceabilityanalysis, from coverable issues (e.g. requirements) <=> Tests <=> Test Runs <=> Defects;
- evaluate Evaluate the coverage status for a given version and see all linked (open/closed) defects;
- see See the tests and test runs that cover each coverable issue, and analyze how that contributes to the overall coverage status;
- analyze Analyze the requirements and related executions and defects in a given Test Environment Environment;
- see See what defects are impacting the requirements, or a subset of the requirements of a specific version.
How to use
This report is accessible either from the Xray icon on the project left sidebar or from the standard Reports icon, which includes other kinds of reports besides Xray.
Source coverable issues (e.g. "requirements") can be directly provided using a Basic or Advanced filter:
- Advanced: a JQL query to filter the coverable issues.
- Basic:
- Project: project;
- Assignee: the issue's assignee;
- Component: the component assigned to the issue;
- Fix Versions: versions assigned to the issue;
- Resolution: the workflow resolution;
- Status: the workflow status;
- Contains: the full issue key or part of the summary.
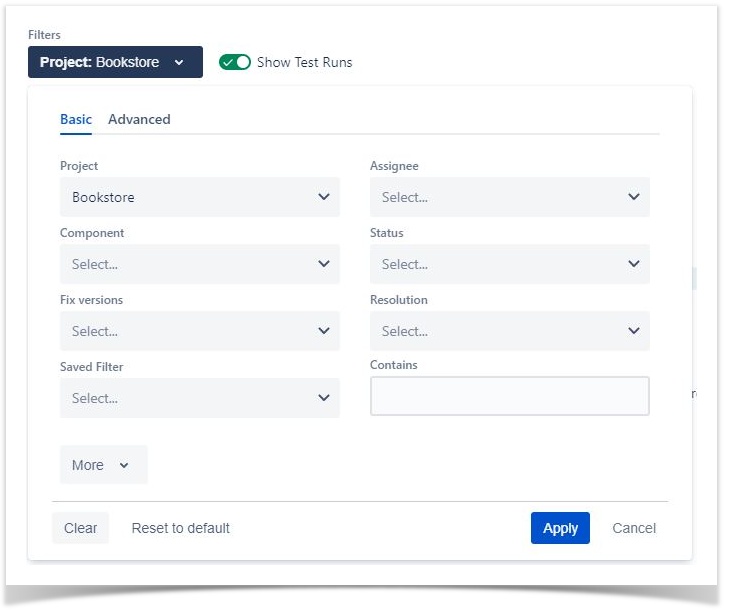
It's also possible to configure the report with additional parameters:
- Show Test Runs: if unchecked, will hide the Test Runs column; this . This is quite useful when you are using Continuous Integration and you have multiple runs runs.
Analysis
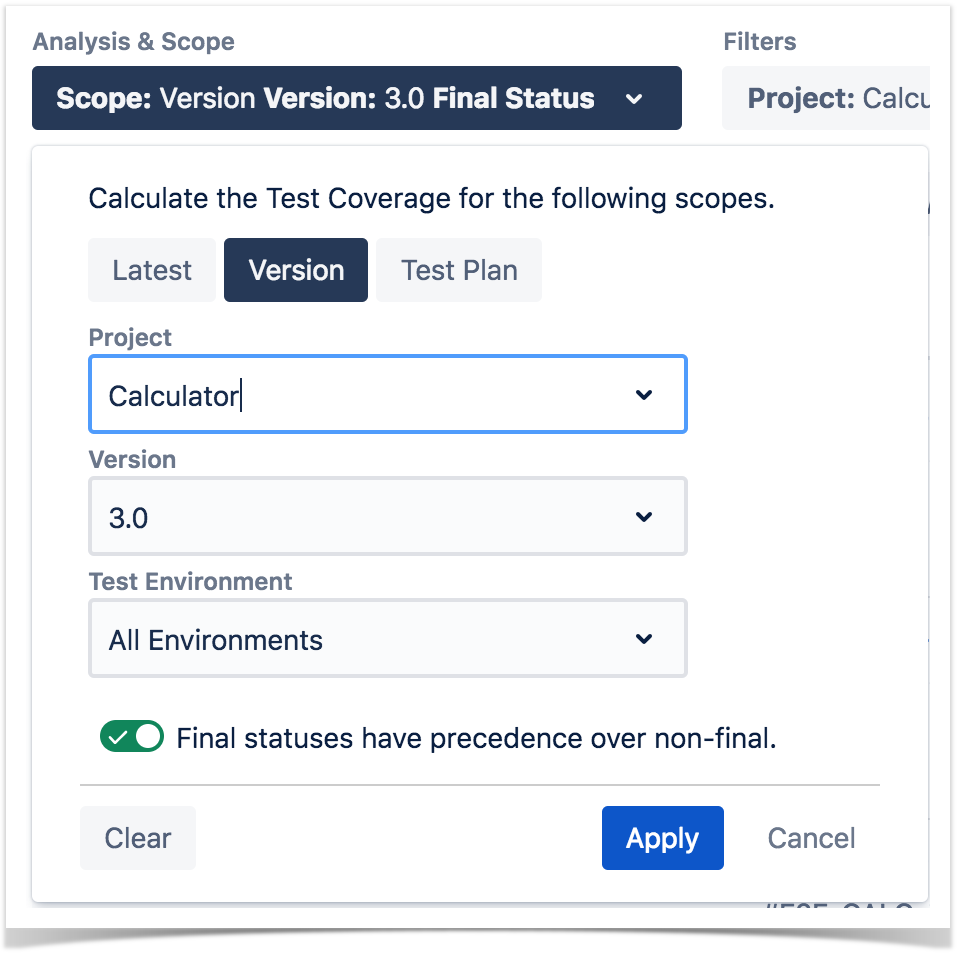
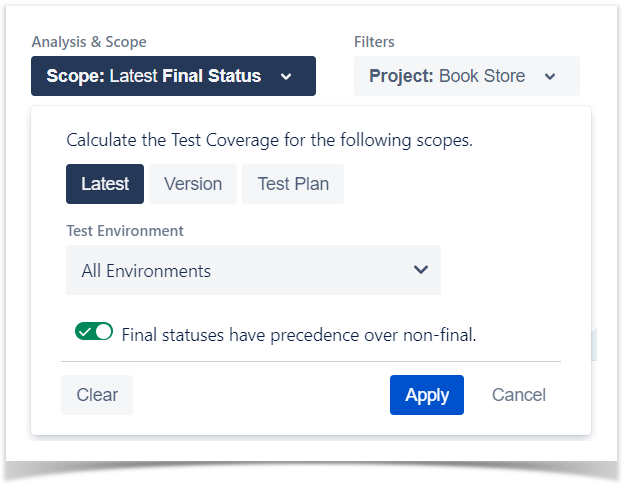
On the left side, it's possible to define the analysis strategy, i.e., the way you want to analyze the selected/filtered requirements. You can choose to analyze either by Latest, Version or Test Plan, and complement it with a Test Environment.
If you choose analysis by by:
- Latest, then the latest results from Test Executions are taken into account;
- Version, then only the Test Executions for the specified version are taken into account
...
- ;
...
- Test Plan, then only the Test Executions (and related Tests and results) for the given Test Plan are considered for the calculation of the coverage status of each requirement.
If the Test Environment is specified, then it considers only the executions within that EnvironmentEnvironment are considered.
| Info | ||
|---|---|---|
| ||
When you choose analysis by Test Plan, the coverable issues (e.g. requirements) are not filtered in any way. Therefore, if you want to restrict the list of requirements that are being shown (e.g., just show the requirements being indirectly covered by the Tests belonging to a Test Plan), you must always use the Filters dropdown. |
...
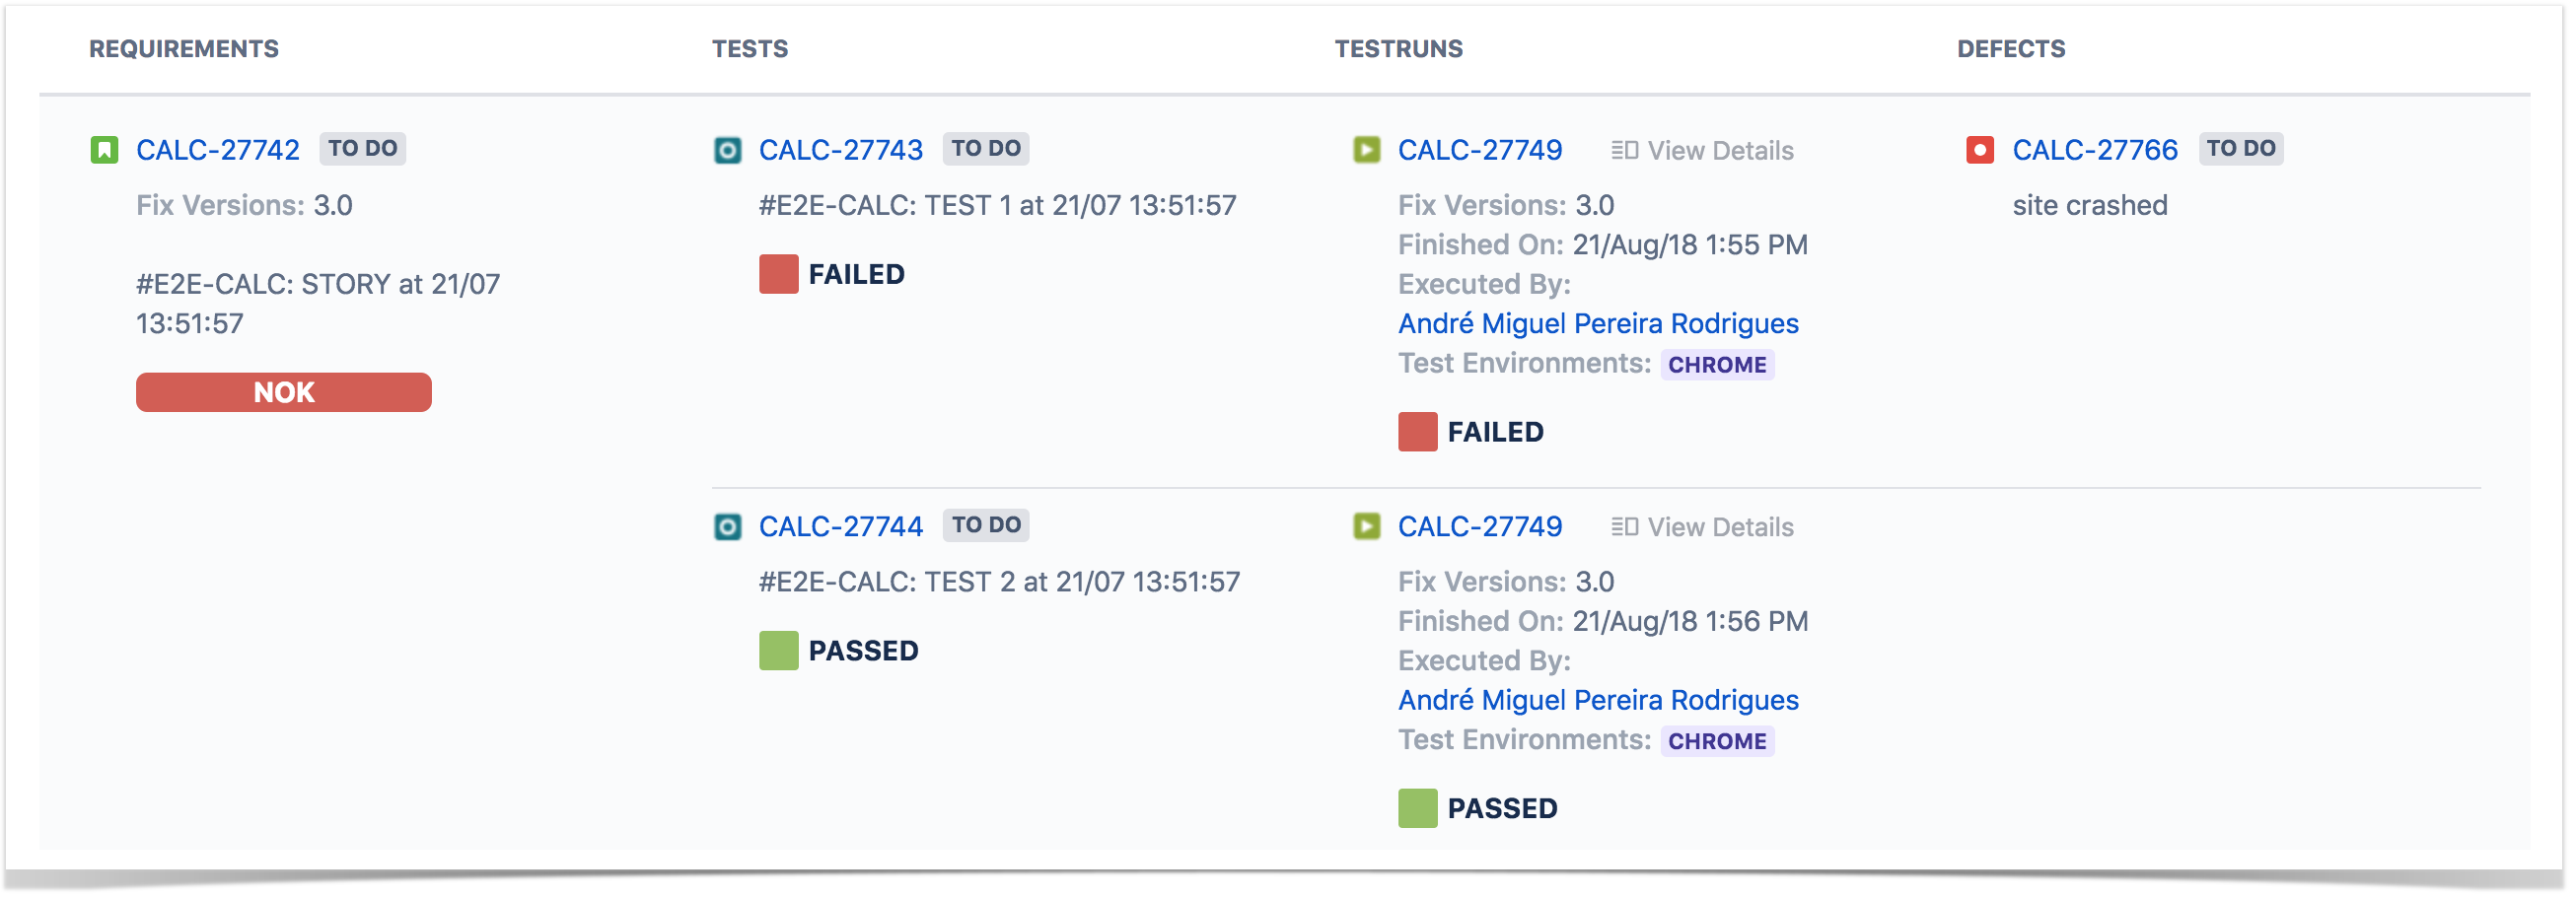
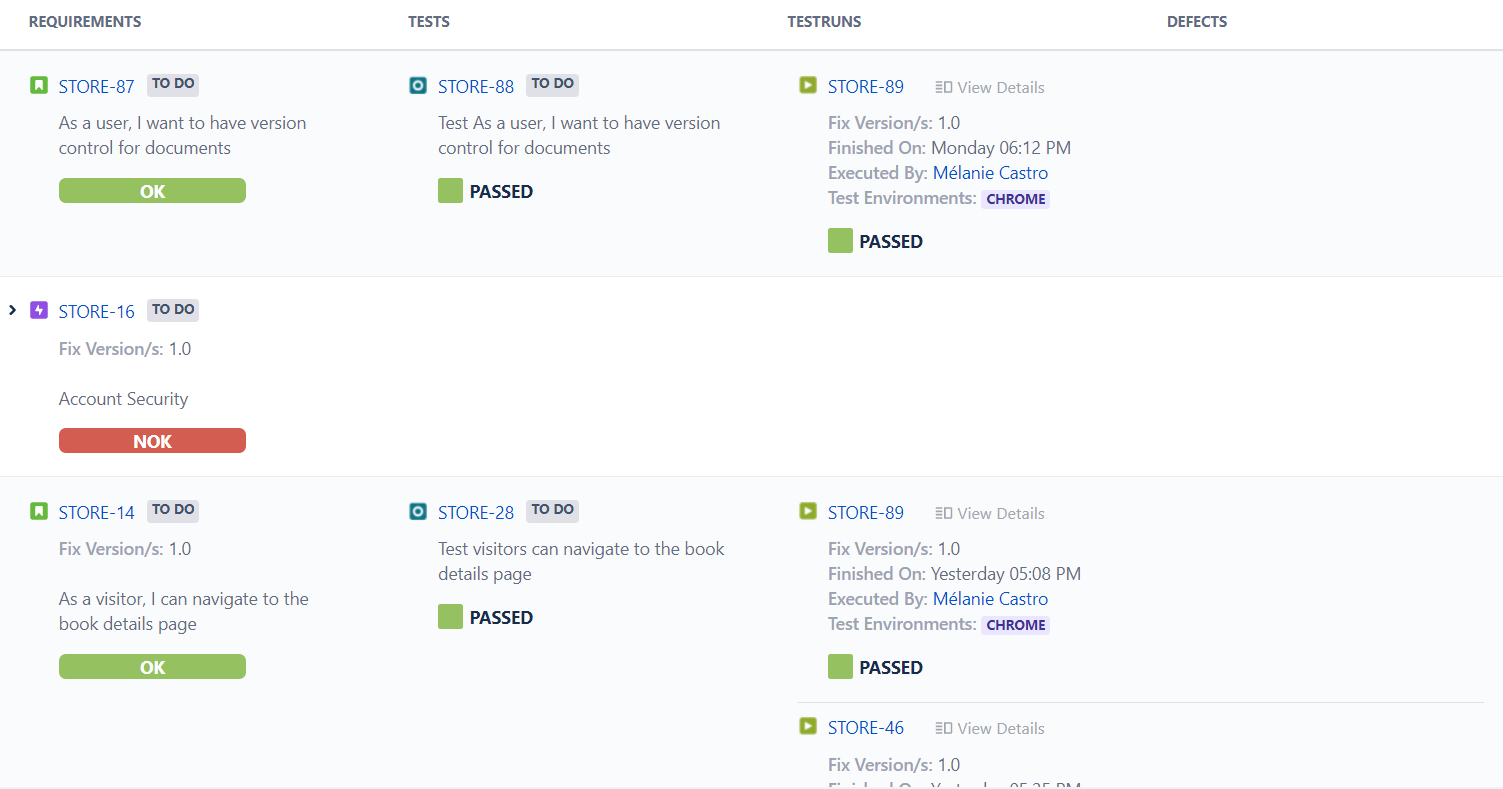
The report not only shows the traceability between entities, but it also presents some calculated values for the selected options. For example, the requirement status and the Test status that are shown in the Requirements and Tests columns, respectively.
| Column | Notes |
|---|---|
Requirements | coverable Coverable issues (e.g. "requirements") " and the calculated coverage status, taking into account the options selected for analysis. |
| Tests | Tests and the calculated status, taking into account the options selected for analysis. |
Test Runs | Test Runs and their status from all related Test Executions (only 3 are shown, but an action allows you to see all of them). |
| Defects | defects Defects directly associated with the Test Runs. |
Performance
In Continuous Integration scenarios, with thousands of runs, showing all those Test Runs at the same time in this report may take some time and may overload your browser.
Therefore, we advise you to hide Test Runs column in the report, if the number of runs is considerable high (e.g. > 1000); the . The amount of information may overload your browser, and it will be hard for you to analyse analyzethe report with all that information.
Examples
Exporting the Report
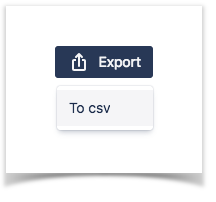
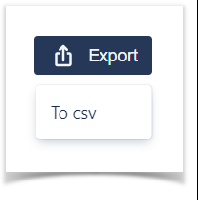
The report can be exported to a CSV file, which will export up to 1000 issues. The export to csv CSV will take into account if the show test runs option is enable.
Click on Export and select To csv.
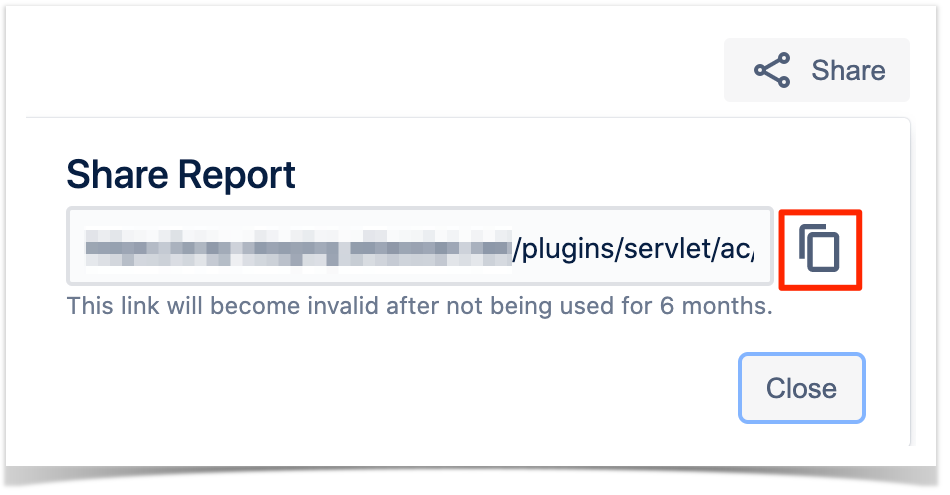
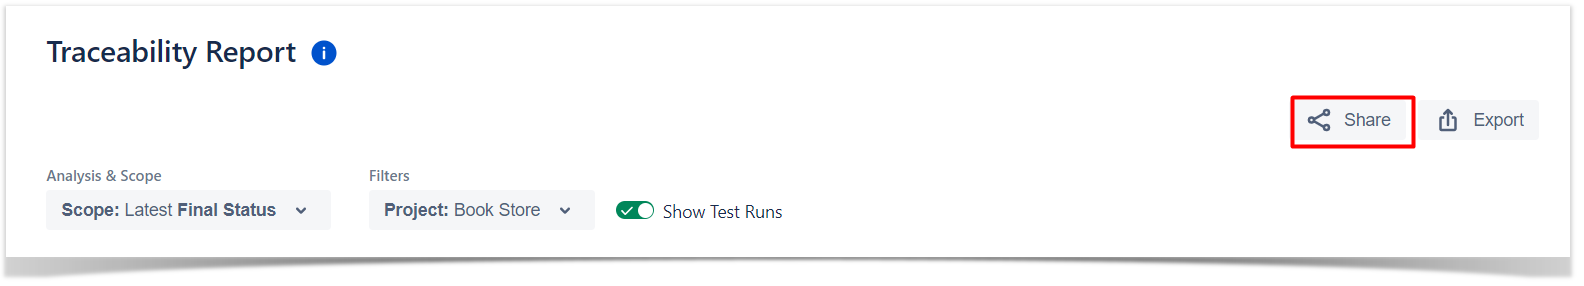
Share
To share the report click the Share button and then click the copy icon to copy the link to clipboard after this you can send the link to other users who can then view the report with the same filters. This link will be deleted if it's not
...
used for more than 6 months.
...
...