The Overall Requirements Coverage Report shows the calculated requirement coverage status for a list of requirements in real-time, in a normalized horizontal stacked bar chart, for the selected version, or Test Plan, and/or Test Environment.
This helps you analyze the current status of your release, or even other releases from the past, by taking into account the respective test results of related Test Executions.
Possible usage scenarios:
Analyze the current status of your release taking into account the status of requirements
Help make decisions about readiness to release, by analysing requirements group by priority
Analyze requirements from earlier versions based on your regression testing.
UI Step
How to use
This report is accessible either from the Xray Reports icon on the left sidebar of the project or from the standard Reports icon, which includes other kinds of reports besides Xray.
At the top of the report you'll find several areas related with the report and with the data shown in the report.
A: Analysis & Scope, for choosing how to analyze the entities
B: Group by, for defining how to visually group/aggregate items
C: Filter, for selecting the source data
D: Visualization information and options
You need to configure the source data (i.e., the requirements) for the chart and how to calculate the requirement status for each one of the requirements.
UI Step
Defining analysis strategy
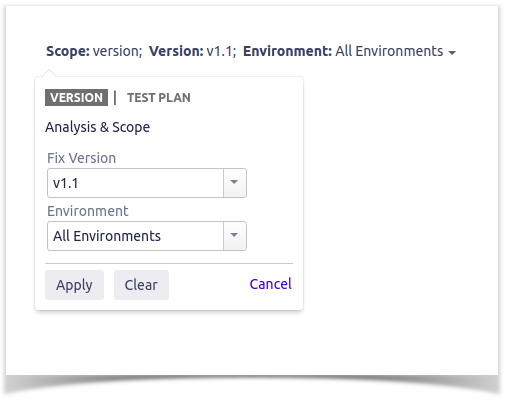
On the left side (within section A), you can define the analysis strategy, i.e., the way you want to analyze the selected/filtered requirements. You can choose either to analyze by Version or Test Plan, and then complement it with a Test Environment.
If you choose analysis by Version, then the latest results from Test Executions for the specified version are taken into account. If you choose Test Plan, only Test Executions (and related results) associated with the given Test Plan are considered during the calculation of the requirement status.
If you specify the Test Environment, then only the executions that ran in the specified environment are considered.
UI Step
Defining Scope with basic tab
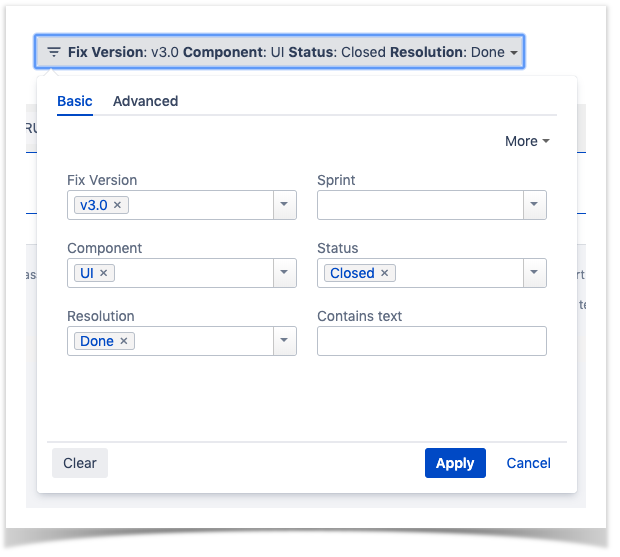
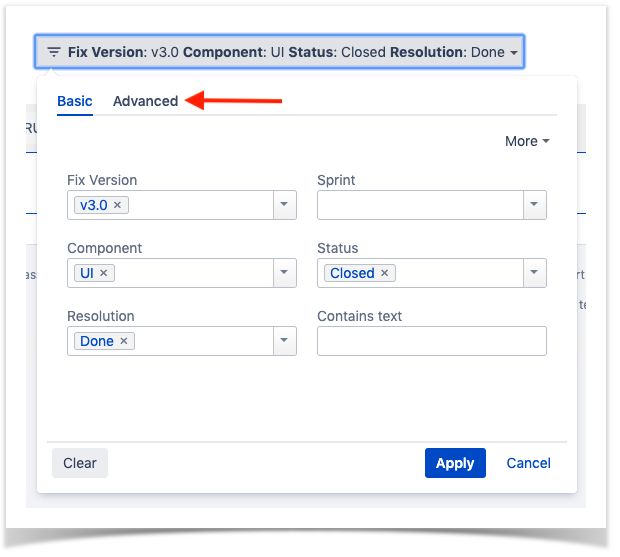
Source "requirement" issues can be directly provided (within section C) using the requirement fields configured in theBasictab or the JQL written in theAdvancedtab.
By default, theBasictab provides the following fields:
Fix Version: Version assigned to requirements
Sprint (Only if Jira Software is installed): Sprint assigned to requirements
Component:Components assigned to requirements
Status: The issue's workflow status
Resolution:The issue's workflow resolution
Contains text: Filter requirements by text
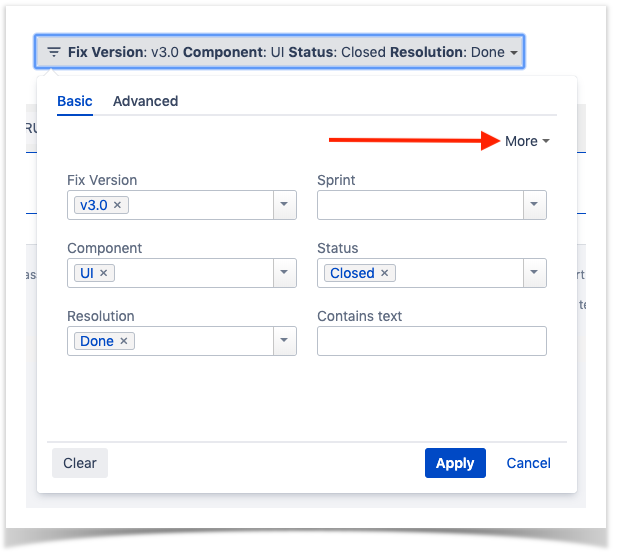
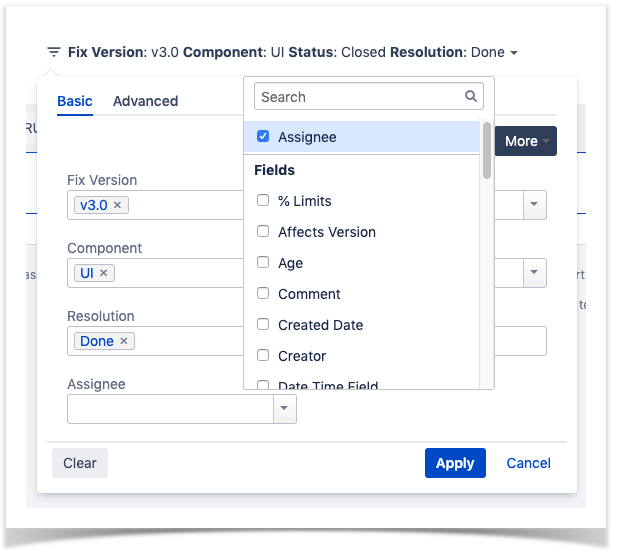
By clicking on More, it's possible to manage which fields will be used to filter the requirements:
Selecting fields will enable to filter further the requirements
Unselecting fields will remove them from the search criteria
Info
The default fields cannot be removed from the dialog
UI Step
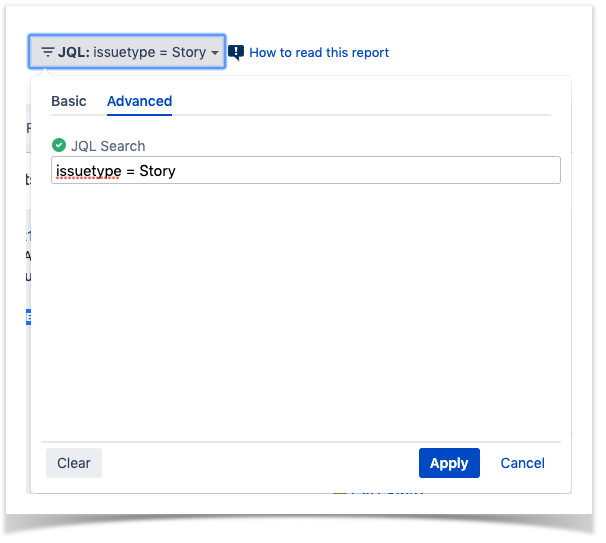
Defining Scope with Advanced Tab
Alternatively to the Basic, the Advanced tab offers the possibility of filtering the requirements via JQL:
If you wish, you can clear the filter in order to see all Requirements once again. You can do this by clicking on the Clear button and then press Apply.
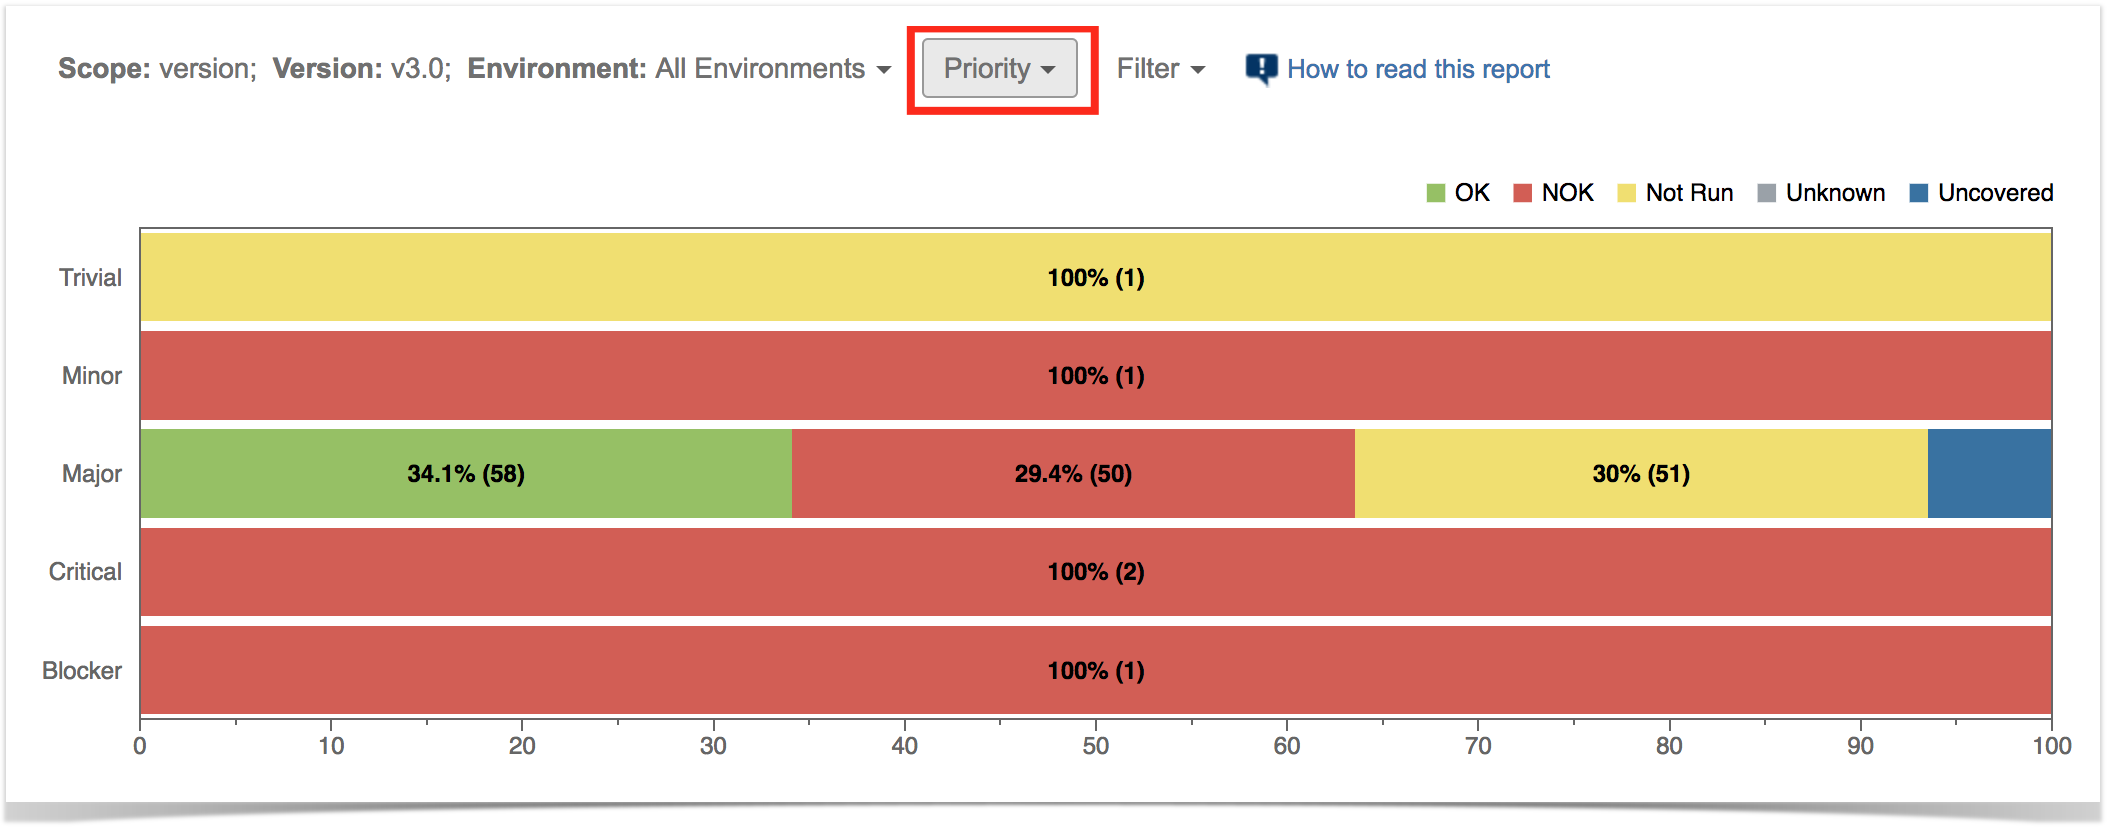
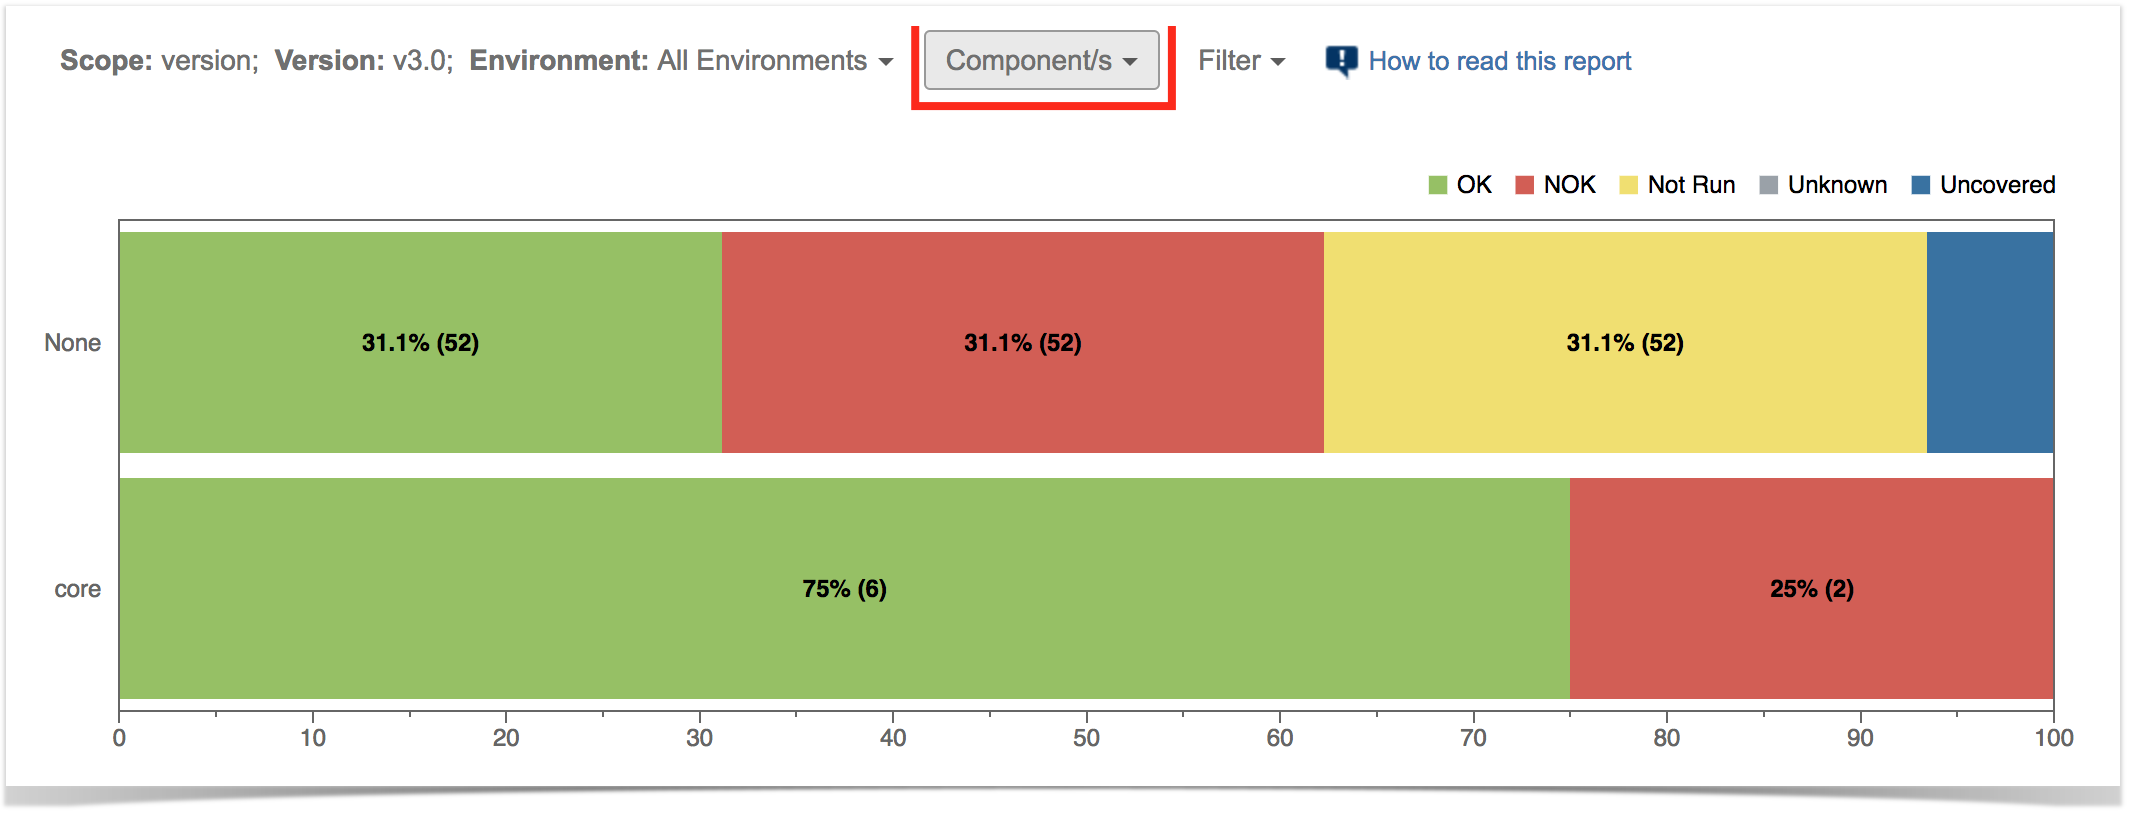
You can visually group the requirements (within section B) by Priority, Component or other fields, so you can analyze requirements from different perspectives.
Section
Column
Column
UI Step
Select the visualization option
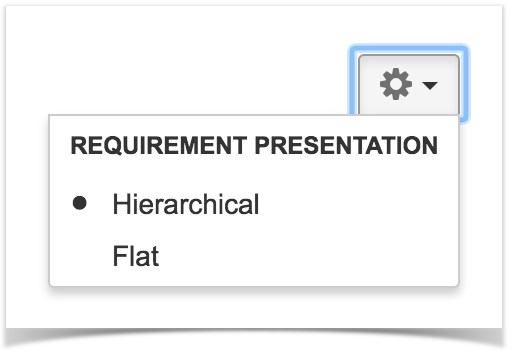
There is also an options menu (section D) where you can choose the visualization type for the report:
hierarchical - only the parent requirement issues will be presented in the report, if the filter includes them. Sub-requirements can still be visualized in the overall details table.
flatten - the requirement issues will not consider the parent/child relationship. All parent and child requirements will be considered and showed similarly in the report.
UI Step
Example
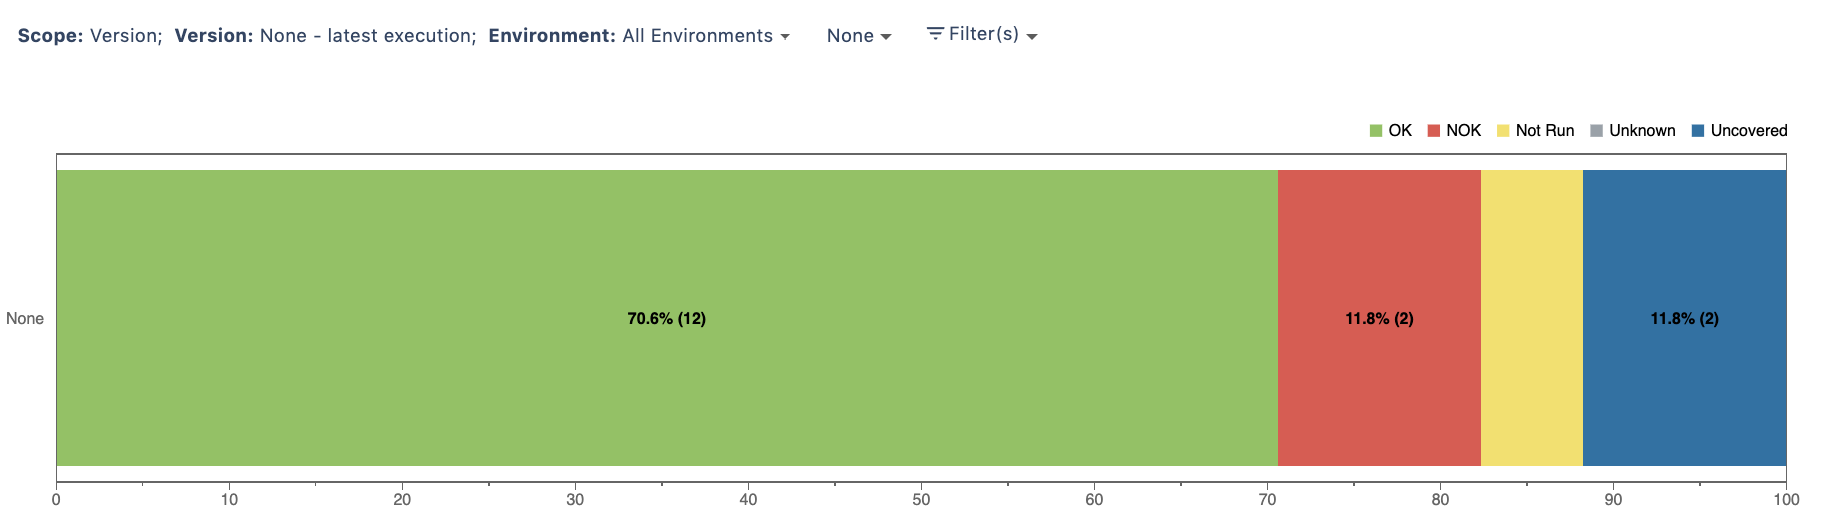
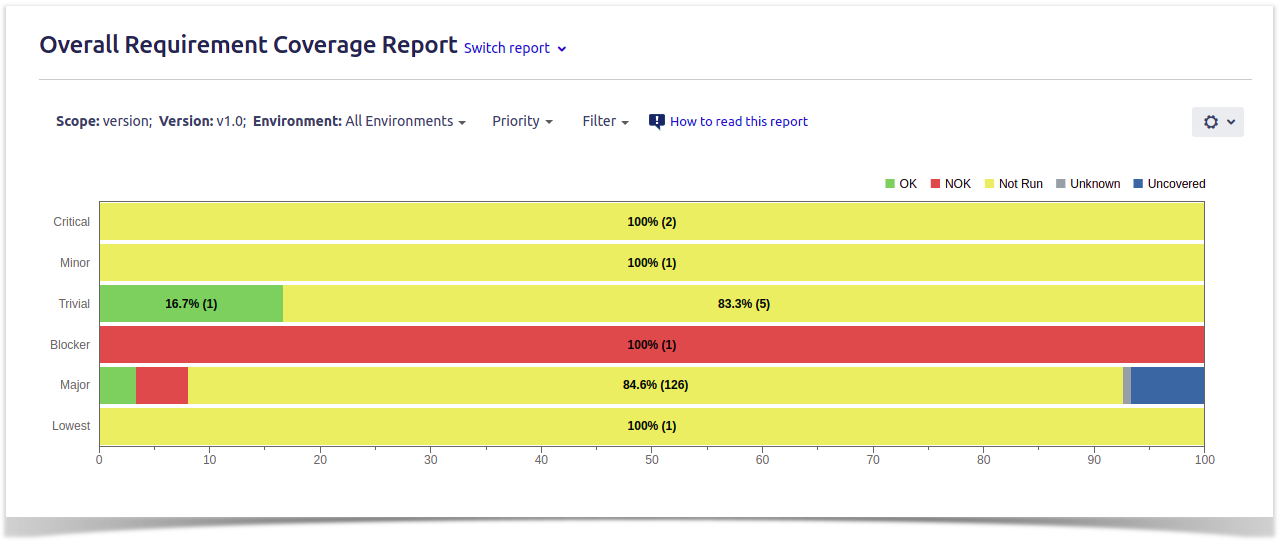
Each bar on the chart represents a group of Requirements with a different value provided by the grouping field.
Stacked within each bar are the Requirements grouped by coverage status: OK, NOK, NOT RUN, UNKNOWN and UNCOVERED.
Tip
The Overall Coverage requirements chart is interactive. Hovering over each bar shows a small popup with the information on the specific series (Status, Grouping Field and Percentage). You can deactivate a particular series by clicking it in the series legend.
Because this is a normalized chart, the bars are always 100% wide.
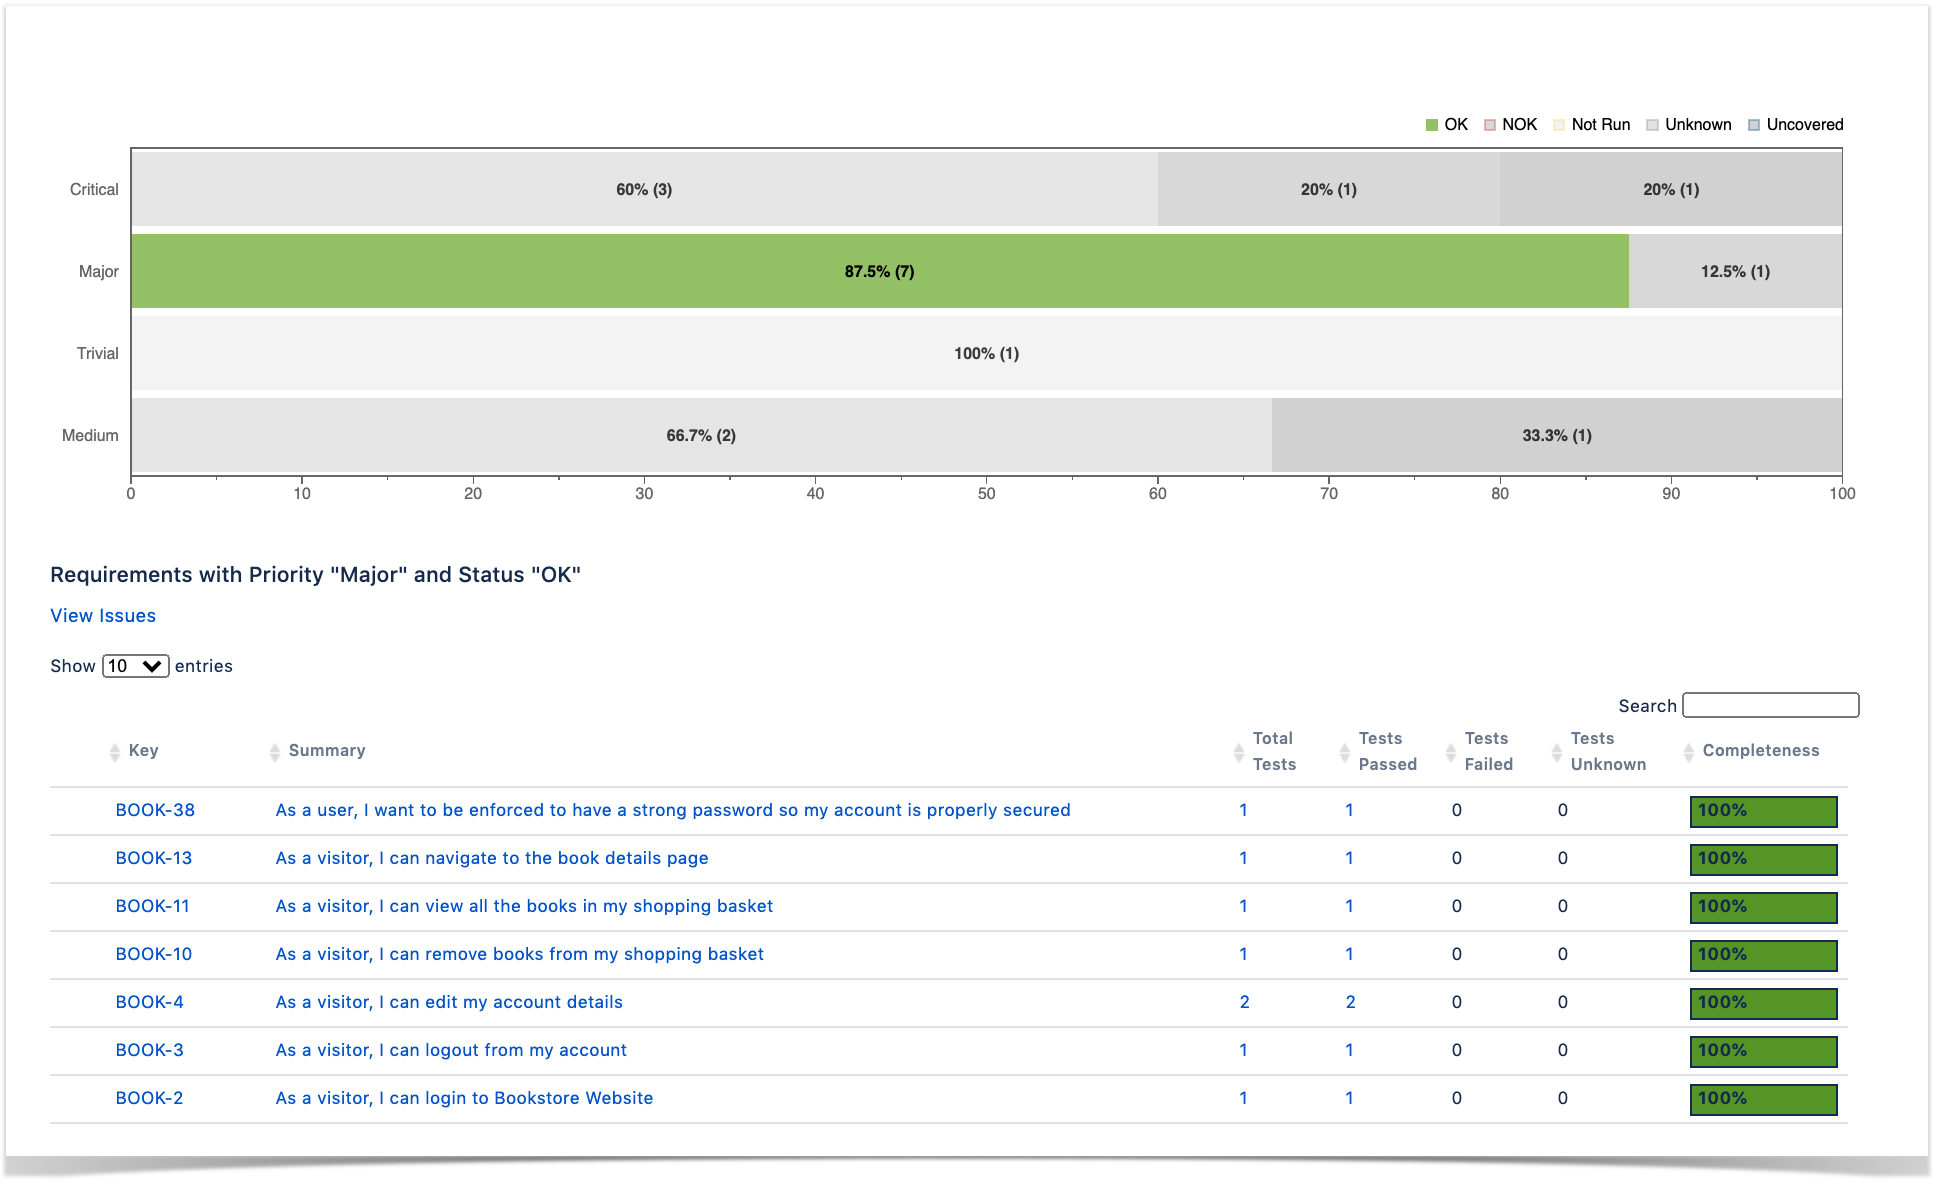
The chart also supports drill-down. When a section is selected, a table appears below the chart with the Requirement issues.
For each Requirement issue, the table shows the following indicators:
Total Tests
Passed
Failed
Unknown
It also contains a column with a progress bar that shows the completeness of a Requirement.
Some values may provide a link, so you can be redirected to the respective entities corresponding to the shown number.
UI Step
Share
The report can be shared by copying and sending the URL located in the browser's address bar.
When opening the report, the Analysis & Scope, Filter, Group by and Requirement Presentation options will be automatically populated with the values provided in the URL.
Tip
To better understand how coverage works, we recommend you to check the "Understanding Coverage" module.