
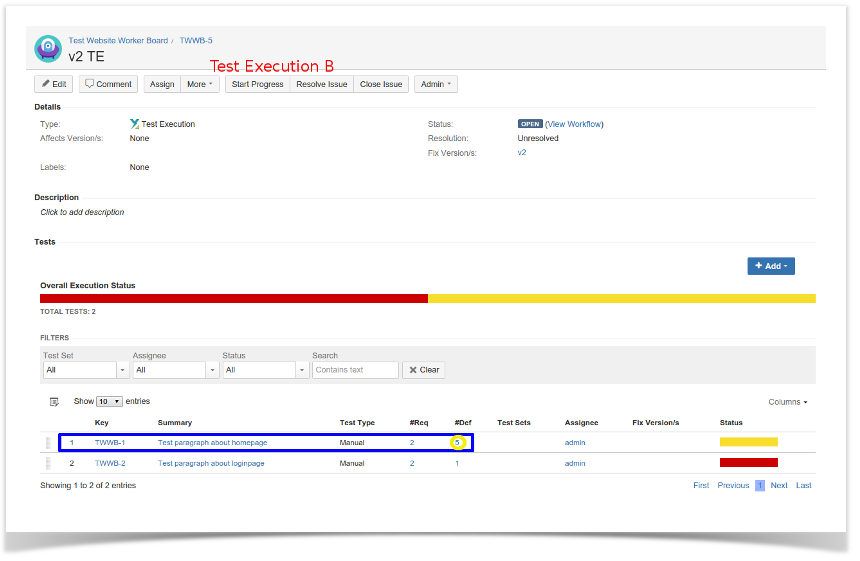
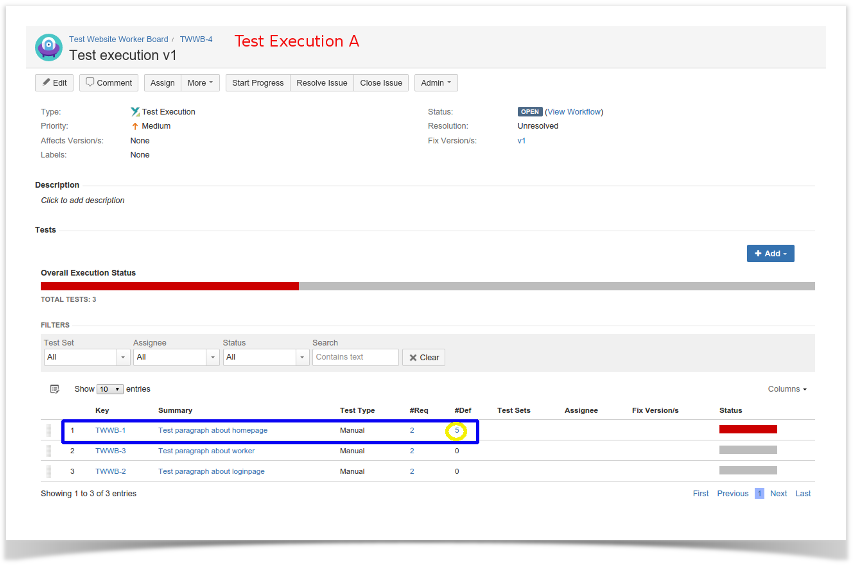
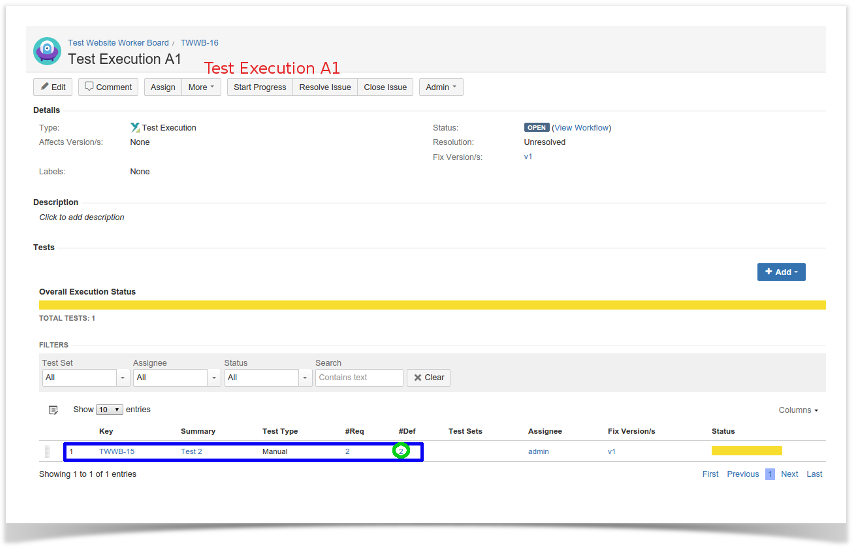
In the Test Execution View Page, each row of the table represents a Test being executed by this Test Execution.
One of the default columns is #Def, which represents the number of defects created during execution of each Test.
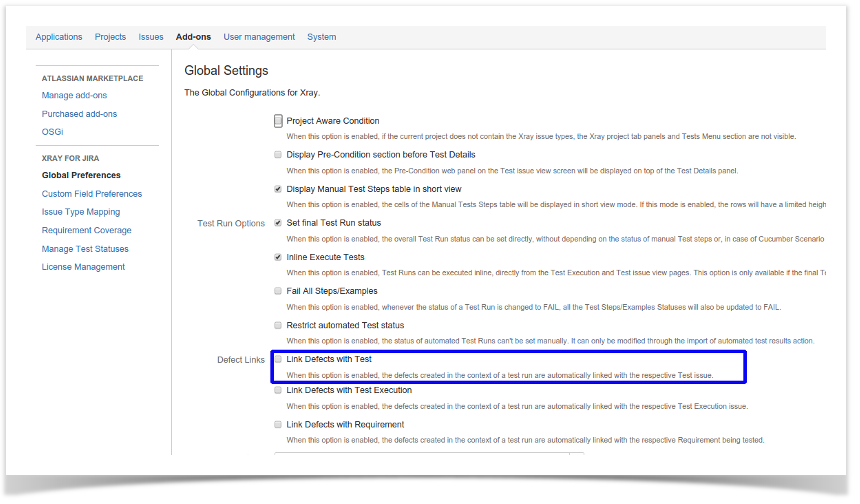
Rule of counting
The rule for counting defects for each Test is to sum
- all defects created during execution
- all defects linked with issue link type "created"
- all defects linked with issue link type "tested by"
Each defect will only be counted once.
Example 1: Defects linked to a Test

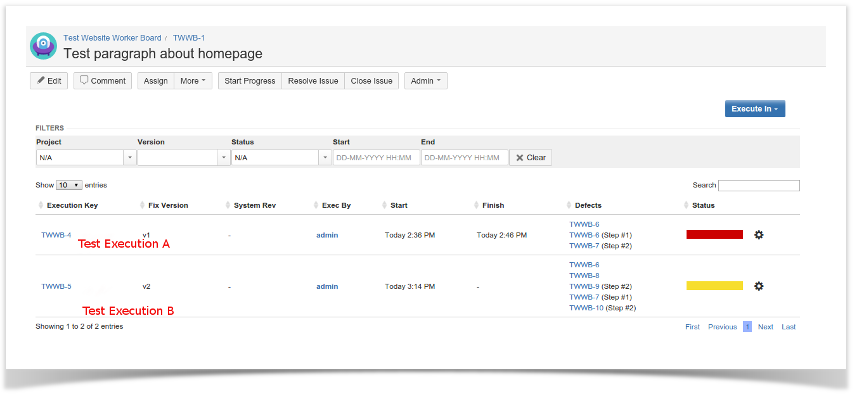
Test 1 was executed in Test Execution A and Test Execution B.
We can see that there were 3 defects generated by Test Execution A (TWWB-6, TWWB-6 (Step #1), TWWB-7 (Step #2)) and 5 defects from Test Execution B (TWWB-6, TWWB-8,TWWB-9 (Step #2), TWWB-7 (Step #1), TWWB-10 (Step #2)).
If we go to each of this Test Executions, we will see that each Test counted 5 defects.
Example 2: Defects not linked to a Test
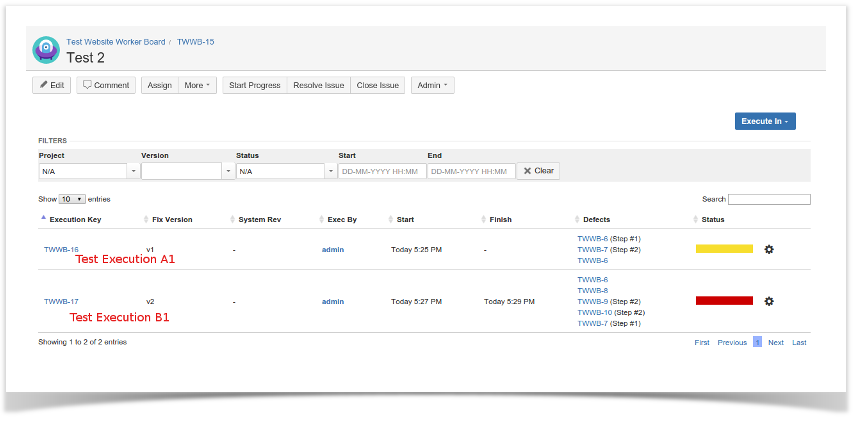
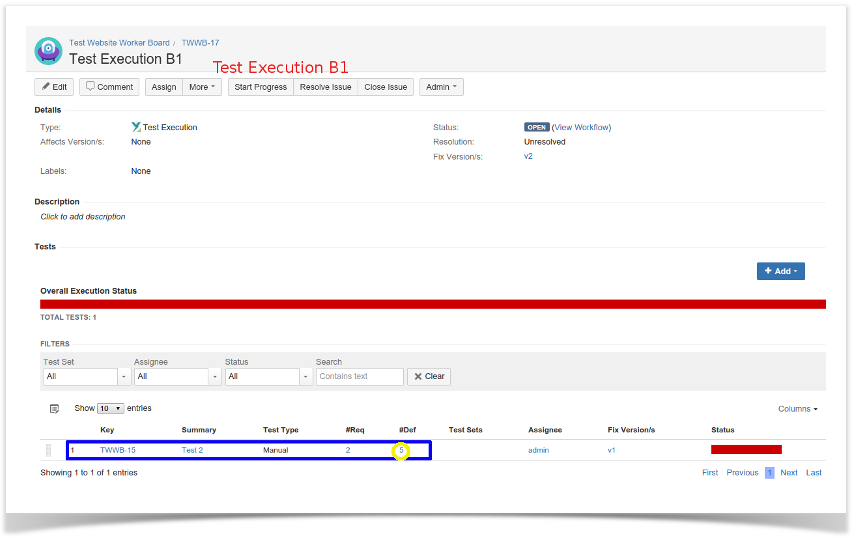
Test 2 was executed in Test Execution A1 and Test Execution B1.
We can see that there were 3 defects generated by the execution Test Execution A1 (TWWB-6, TWWB-6 (Step #1), TWWB-7 (Step #2)) and 5 defects from Test Execution B1 (TWWB-6, TWWB-8,TWWB-9 (Step #2), TWWB-7 (Step #1), TWWB-10 (Step #2)).
If we go to each of this Test Executions, we will see that each one Test had 3 defects and the other had 5 defects.
Results explanation
The only difference between those two examples is that we removed the link creation between Test and Defect. When Xray counted the bugs from Test Execution A and Test Execution A1, the differences resides in the links Test 1 and Test 2 had to the defects created in the other Test Executions.