What you'll learn
- Define tests using Locust
- Define KPIs, run the test and push the test report to Xray
- Validate in Jira that the test results are available
Overview
Locust is an open source load testing tool that uses Python to write the tests.
Because it uses Python to define the tests, it is more friendly for developers and inherited all potentiality of being driven by a language such as Python.
Even though it does not provide out of the box the ability to define and use KPIs, it has hooks and extension mechanisms that will allow an implementation to support this need.
Pre-requisites
We will start to define a simple load test in Locust that will target a demo site (travel agency) supplied by BlazeMeter that you can find here.
The test will exercise 3 different endpoints:
- Perform GET requests to the "/login" endpoint
- Perform POST requests to "/reserve" endpoint (where we will attempt to to reserve a flight from Paris to Buenos+Aires)
- Perform POSt requests to "/purchase" endpoint (where we will try to acquire the above reserved flight adding the airline company and the price)
To start using Locust please follow the documentation.
The test will be simple as we have defined above, so let's look in more detail on what are each part is exactly doing
The file will have two classes, one to define the requests we want to do and another to specify the endpoint and the tasks we want to execute.
The first Class we see is FlightSearchSimulator that is of the type TaskSet this allows you to mimic your site structure and organize the tests the same way your site is organized (in this case we are using to demonstrate the capacity because as the example is simple we will not need it).
Within the class we can see @tasks decorators that will indicate to Locust that these are the tasks to be executed in the test.
The second class, MyLocust, is used to define what are the tasks to be executed, and this is done setting the tasks with a list of tasks to be executed:
tasks = [FlightSearchTest]
In our case only one: FlightSearchTest, but we could define a list of tasks and even define weights of executions.
Finally the target host that will be used as the target of the tests.
In order to execute the tests you can use two ways, using the UI or the command line, in our case we will use the command line.
In the command line we can define a series of parameters that will define the way Locust will handle the test, such as:
- The script we want to execute through the "-f" parameter,
- How many users we want to use with "-u", this will be the maximum number of users,
- The hatching time with "-r" that will define the time period used to add users until we reach the number we have defined earlier
- How long the script will execute with "-t", is this parameter is not passed it will run indefinitely or until interrupted,
- If we want to execute the tests in headless mode with "--headless"
- Generate the CSV output files (exceptions, failures, stats_history and stats)
The final command will be f the form:
locust -f LocustScript.py --headless -u 50 -r 1 -t 1m --csv=example
This command will execute the LocustScript.py in headless mode, will start with one user and grow 1 user each second until reaching the maximum of 50. It will also generate the CSV files and will be executing for 1 minute.
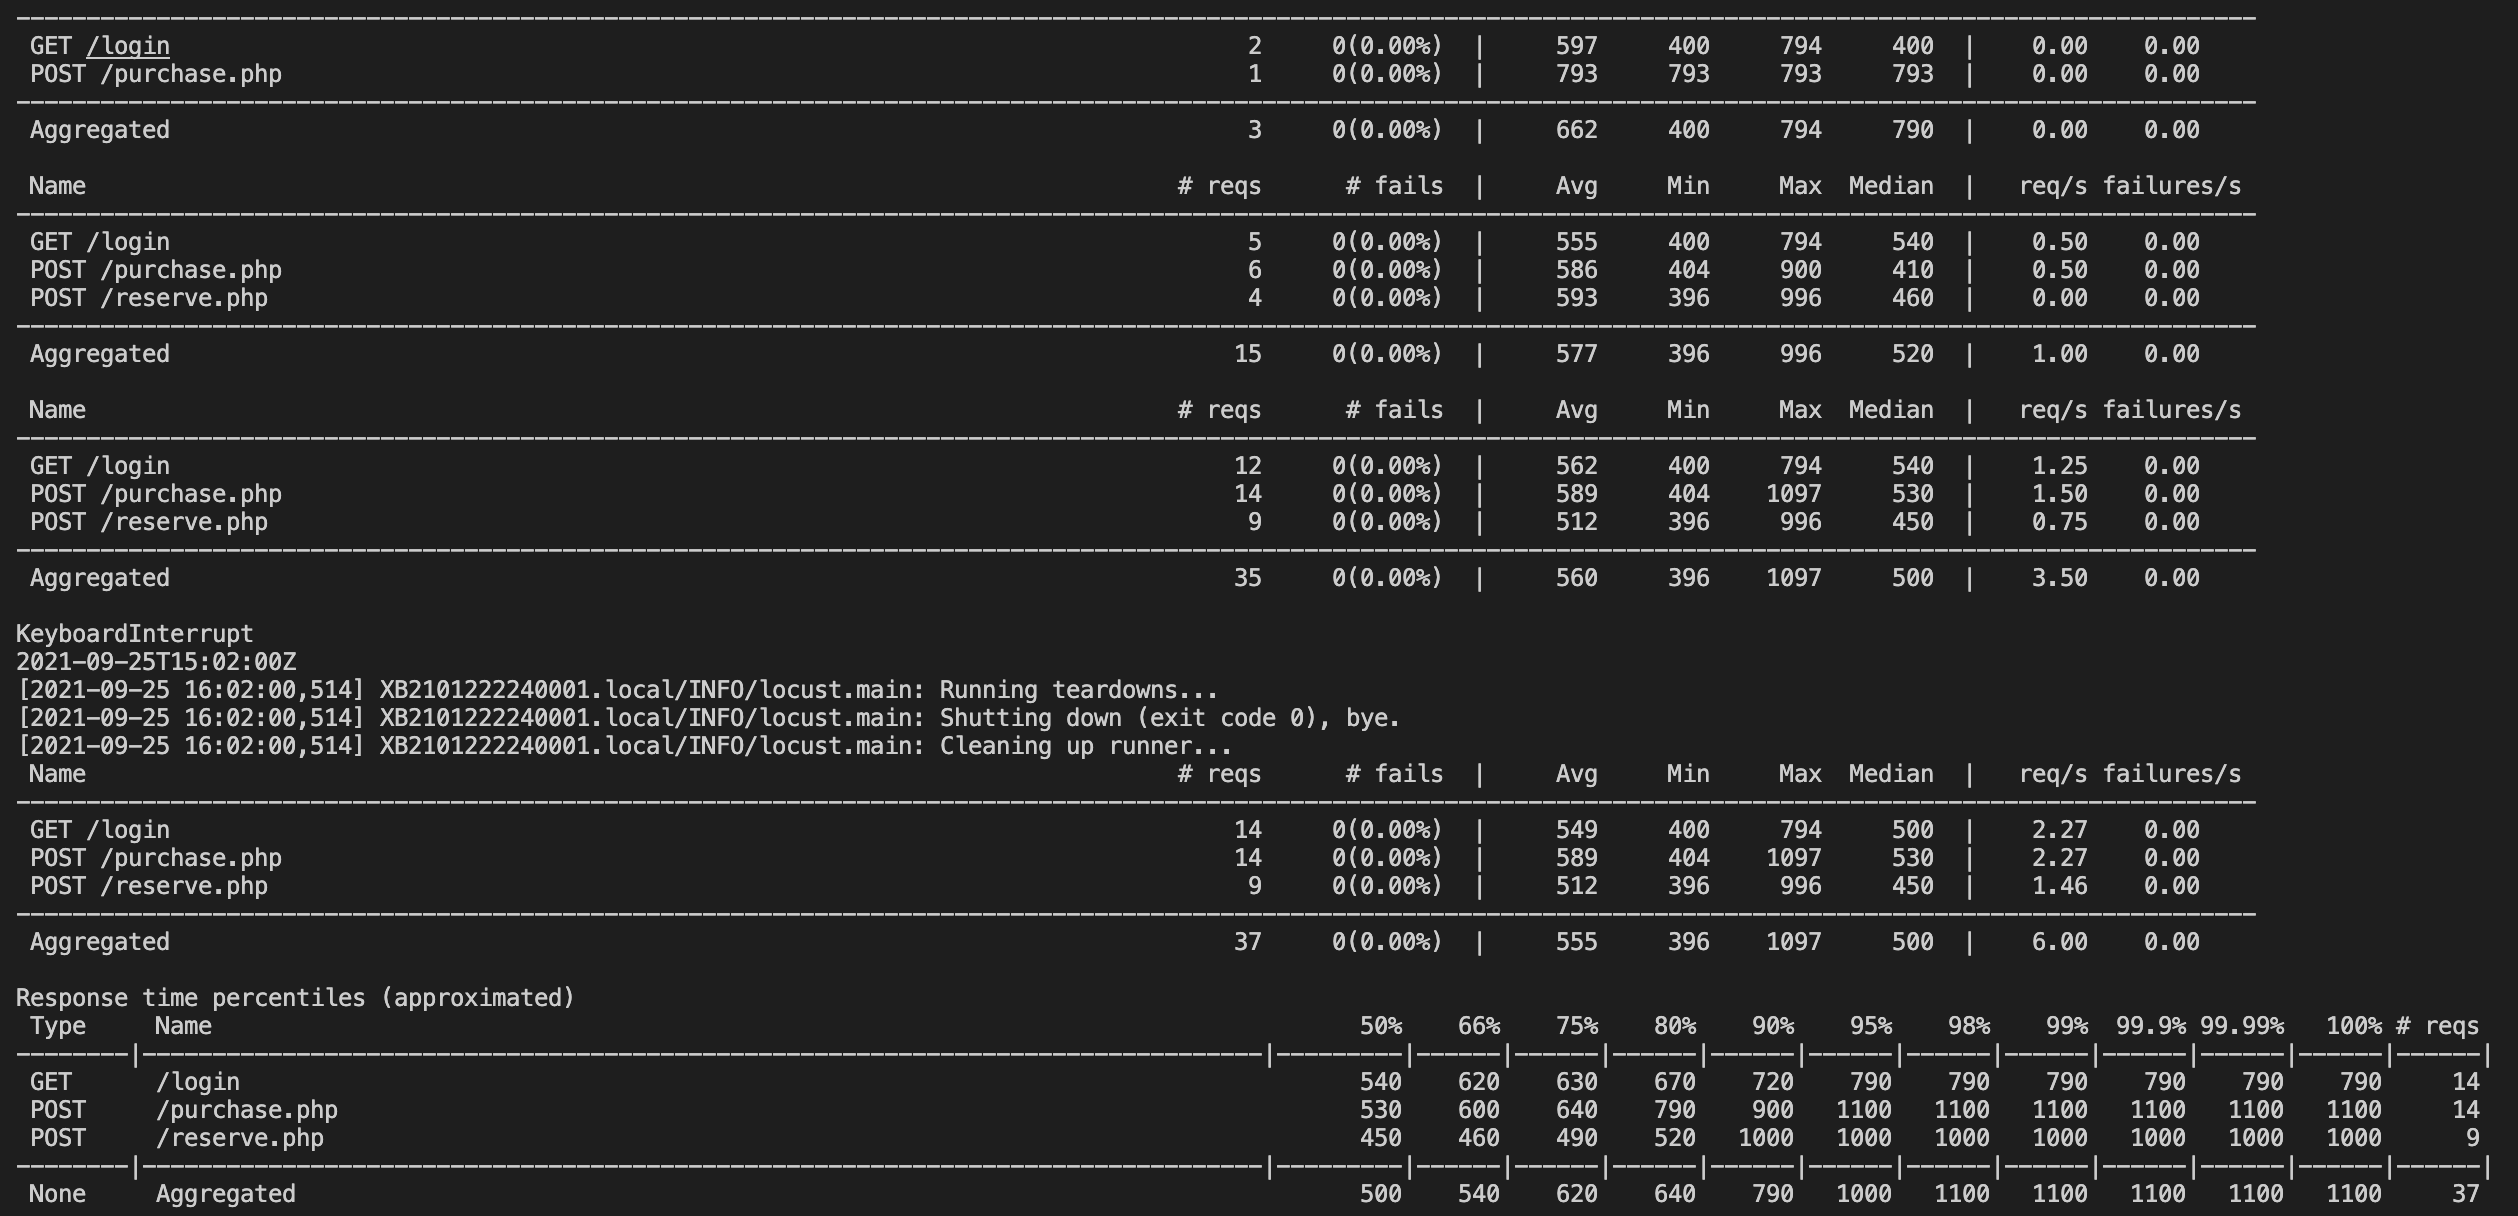
This will be enough to execute performance tests, however a manual validation of results must always be done in the end to assess if the performance is enough of not, and looking at CSV files is not always easy.
We need the ability to:
- Define KPI that will assert the performance results and fail the build of they are not fulfilled in an automated way (this will be useful to integrate in CI/CD tools)
- Convert the KPI result in a way that can be ingested in Xray (generate Xray Json results)
- Visualise the tests in Graphana as they are being executed (a good extra, not mandatory)
In order to do that we will extend Locus and add listeners that will interpret the results and evaluate their output and also redirect the logs to Graphana to be viewed.
KPI
In order to use performance tests in a pipeline we need those to be able to fail the build if the result is not the expected, for that we need to have the ability to automatically assess if the performance tests were successful (within the parameters we have defined) or not.
For demonstration purposes we will use the following implementation present in GitHub, this will allow us to define KPIs per request, the KPIs being used are:
- RPS (Requests Per Second)
- Percentile 90
- Error Rate
This enable us to define KPis for each request and fail the build in case they are not followed, to do that in our class we will add the following lines:
	def __init__(self, environment):
        super().__init__(environment)

    @events.init.add_listener
    def my_locust_init(environment, **_kwargs):
        KPI_SETTINGS = [{'/login': [('percentile_90', 5), ('rps', 500), ('error_rate', 0)]},
                        {'/reserve.php': [('percentile_90', 5), ('rps', 500), ('error_rate', 0)]},
                        {'/purchase.php': [('percentile_90', 5), ('rps', 500), ('error_rate', 0)]}]
        KpiPlugin(env=environment, kpis=KPI_SETTINGS)
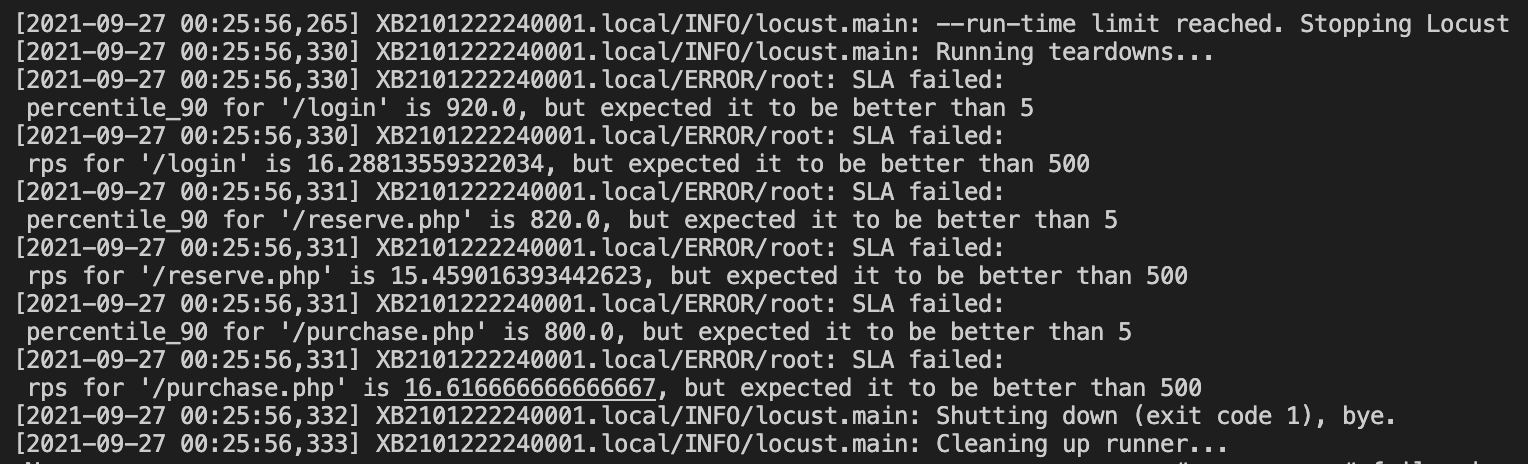
For each one of the endpoints we have defined 3 KPIs (but we could have defined only one or two), in each KPI we define a value that if exceeded will cause an error.
In this example particularly if:
- the 90 percentile exceed 5ms an error will be triggered,
- the requests per second will exceed 500ms an error will be generated
- any error appear during the execution an error will be triggered (because of the error rate KPI).
Once an error is generated we can react and fail the build based on these results.
In the output these results will look like this:
Generate Xray Json
Now we are executing Tests to validate the performance of our application and we are capable of defining KPIs to validate each performance indicator in a build (enable us to add these Tests to CI/CD tools given that the execution time is not long), so what we need is to be able to ship these results to Xray to bring visibility over these types of Tests also.
We have seen that Locust produces CSV files of the requests and errors (valuable to perform a post analysis but hard to convert into proper pass or fail result) but we need to produce a result that will hold all the information produced and will bring value to our project, to do so, we are going to create an Xray Json report to hold these results.
First let us explain the approach we are taking towards these performance Tests, in Xray we have defined 3 Tests:
- COM-158 Error Rate
- COM-159 Requests Per Second
- COM-160 90 Percentile
Each one of them will gather the results of those indicators in our application and failure or success will depend on all the endpoints for each indicator we are considering for our application.
If any of those fail we can check the details and understand what particular endpoint have failed, but overall what is important is that the overall result will dictate if the it was successful or not.
The last change will done in the "kpi_listener.py" where we are going to add logic to create the Xray Json file, append the CSV to the file and write the output to a file, for that we have created new methods that will handle that logic:
Let's look to each addition in more detail:
- injectCSVFile - Method that will read the CSV that Locust generate by default, encode the contents in Base64 and return the corresponding string
- appendToXrayResult - This method will create the Xray Json file with proper structure by adding information in the right places (check the Xray documentation regarding the Xray Json report)
- writeToXrayResultFile - Method that will write the Xray Json to a file in order to be available for processing after the Test as finished
Now when we execute the tests we will have the CSV files produced by Locust and one extra file named "xrayResults.json" that will have all relevant information in a way that Xray will ingest this file and create the corresponding Test Execution with details.
On example of the Xray Json file is:
This is just an example of one possible integration, you can reuse it or come up with one that better suites your needs.
Graphana & Graphite
Most of the time the reports and logs generated by performance tests are not human friendly, either by the number of results or because they are hard to read, even during the test execution it is hard to understand if it is going as expected or not.
In order to provide a way to visualize those results in Graphana (known as the open observability platform) we have extended Locust and registered a listener that will ship the logs to Graphite (time series database).
We have followed the BlazeMeter tutorial and, as described there, we use a Docker image to run an instance of Graphite and Graphana where we can validate our local performance tests, for that use the image present here:
git clone https://github.com/kamon-io/docker-grafana-graphite.git
Once you have extracted the contents, enter the directory and run:
make up
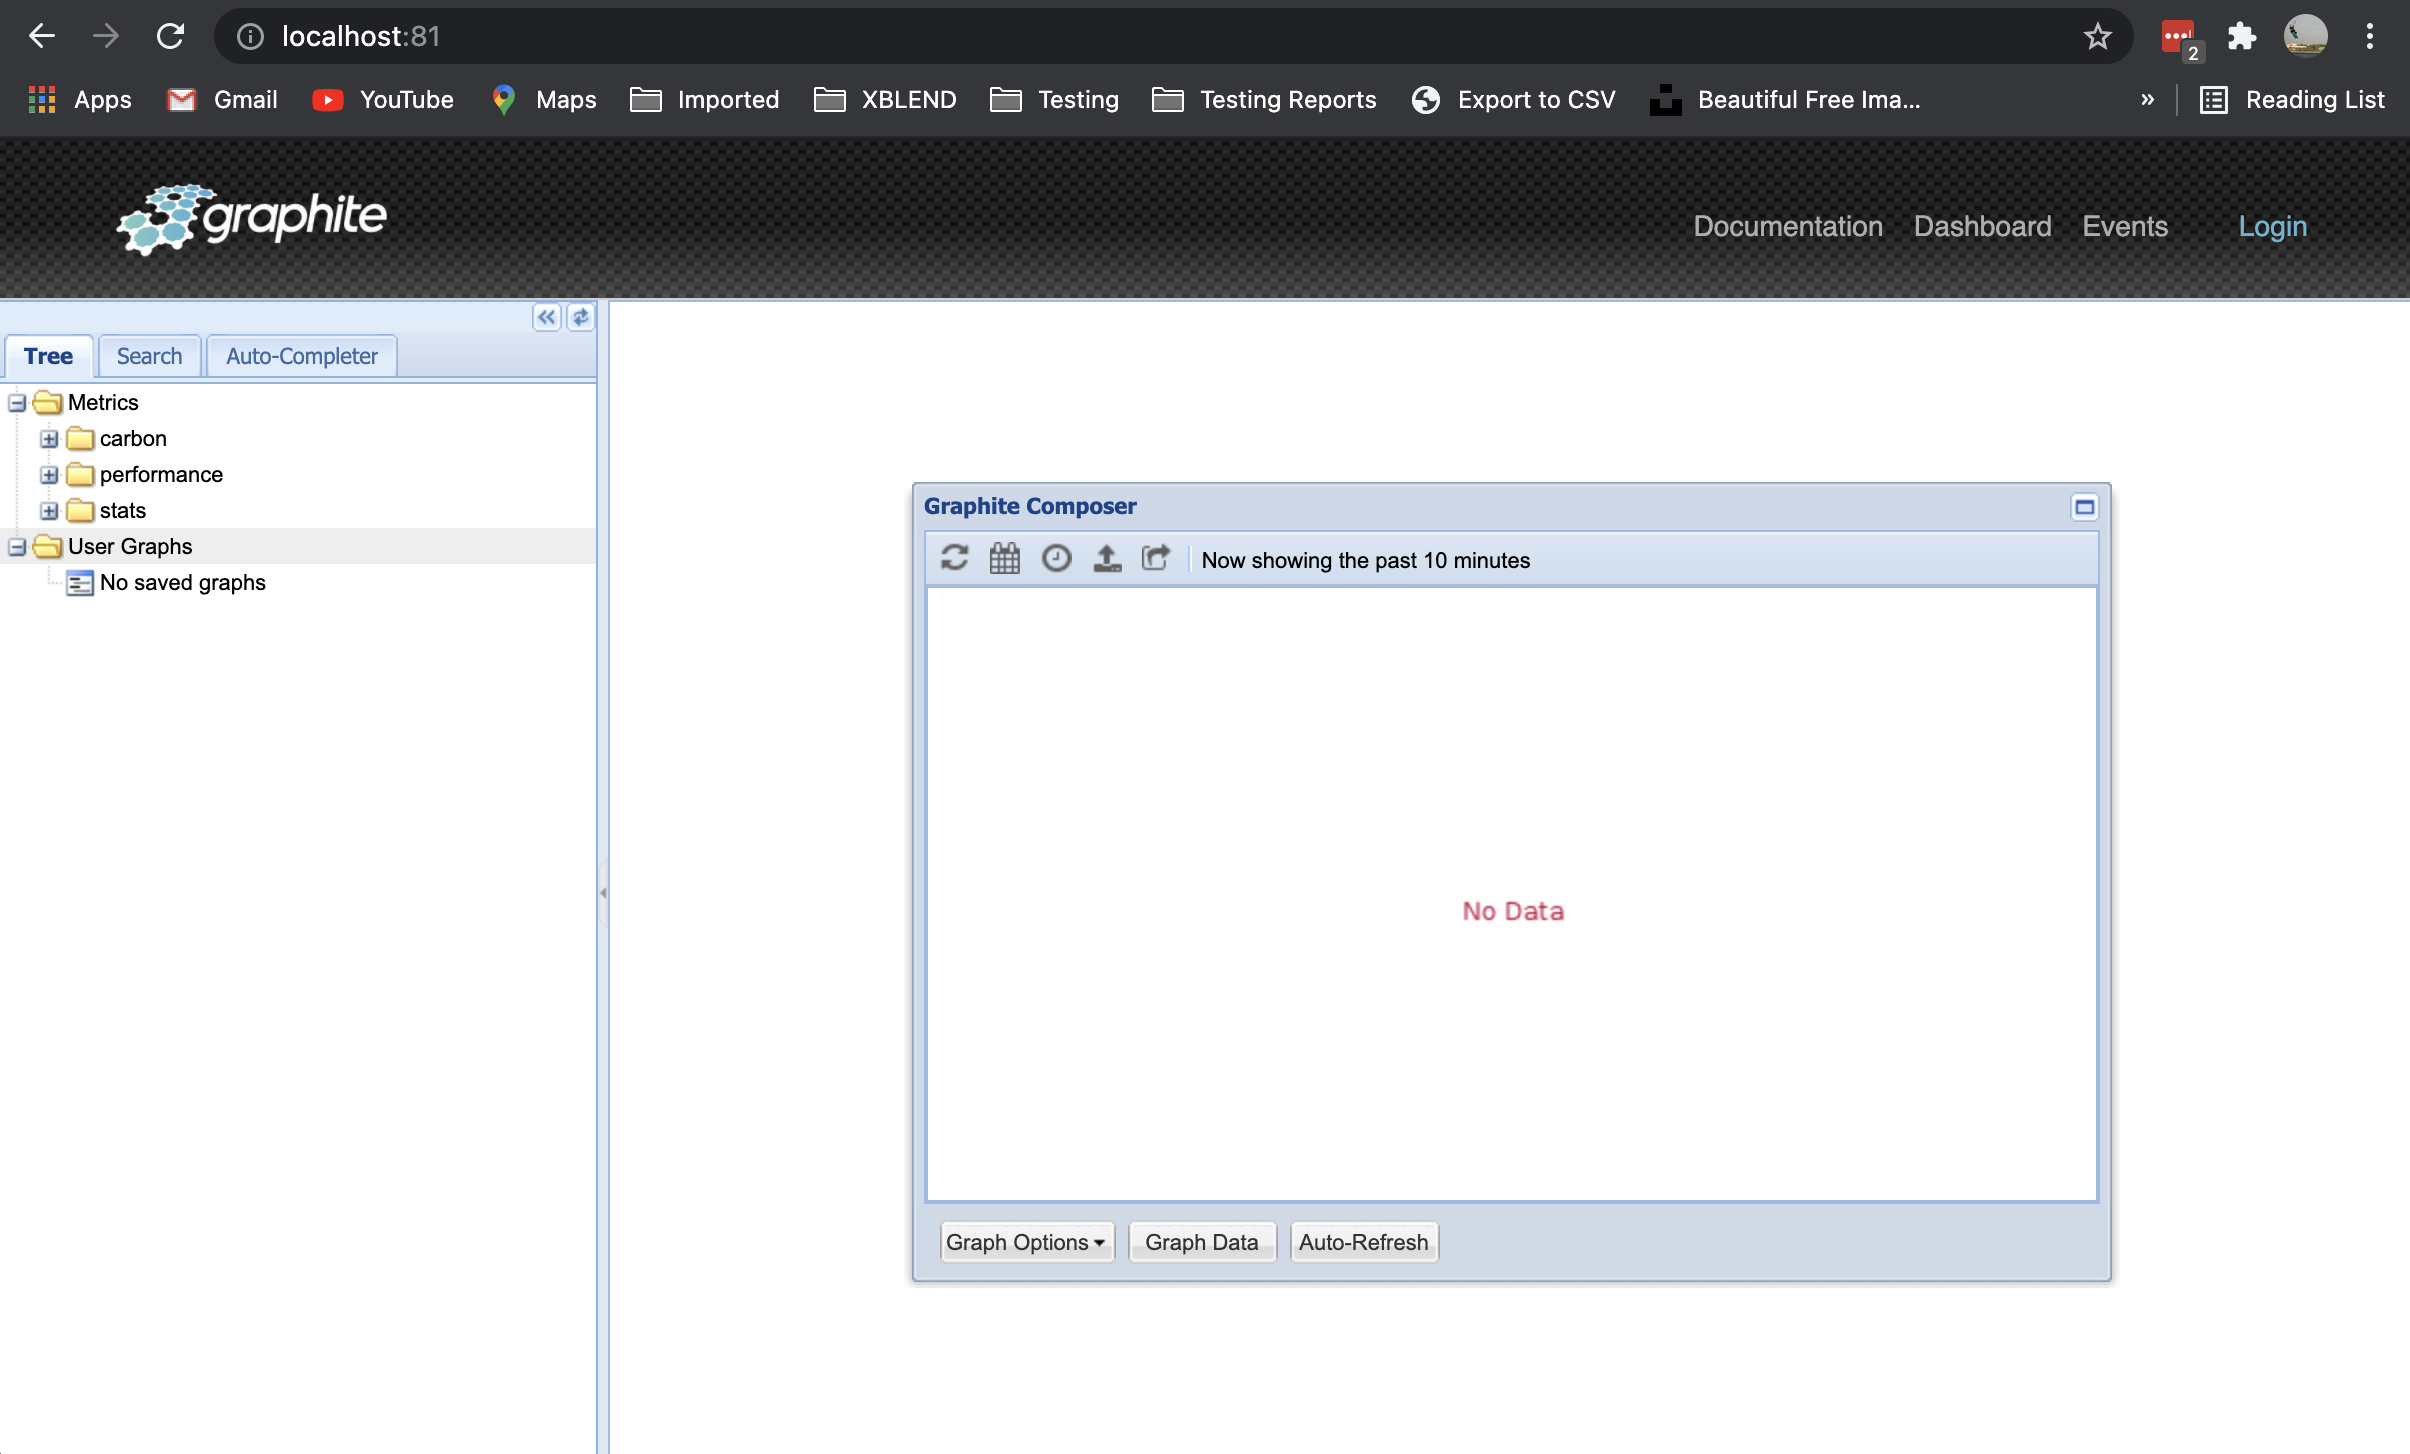
This command will start and Docker instance of Graphana in localhost:80 and of Graphite in localhost:81
We have extracted the code in a class in order to be easily used in your tests, the python script that have resulted from that extraction is below
In more detail we can see that we have created a socket connected to the default port of the Graphite tool and two lists with the successful requests and the failed ones, the way we manage to obtain those is by plugin two listeners in Locust:
- events.request_success.add_listener(self.hook_request_success)
- events.request_failure.add_listener(self.hook_request_fail)
In order to use this new class in our Locust tests we must add these lines to our test script
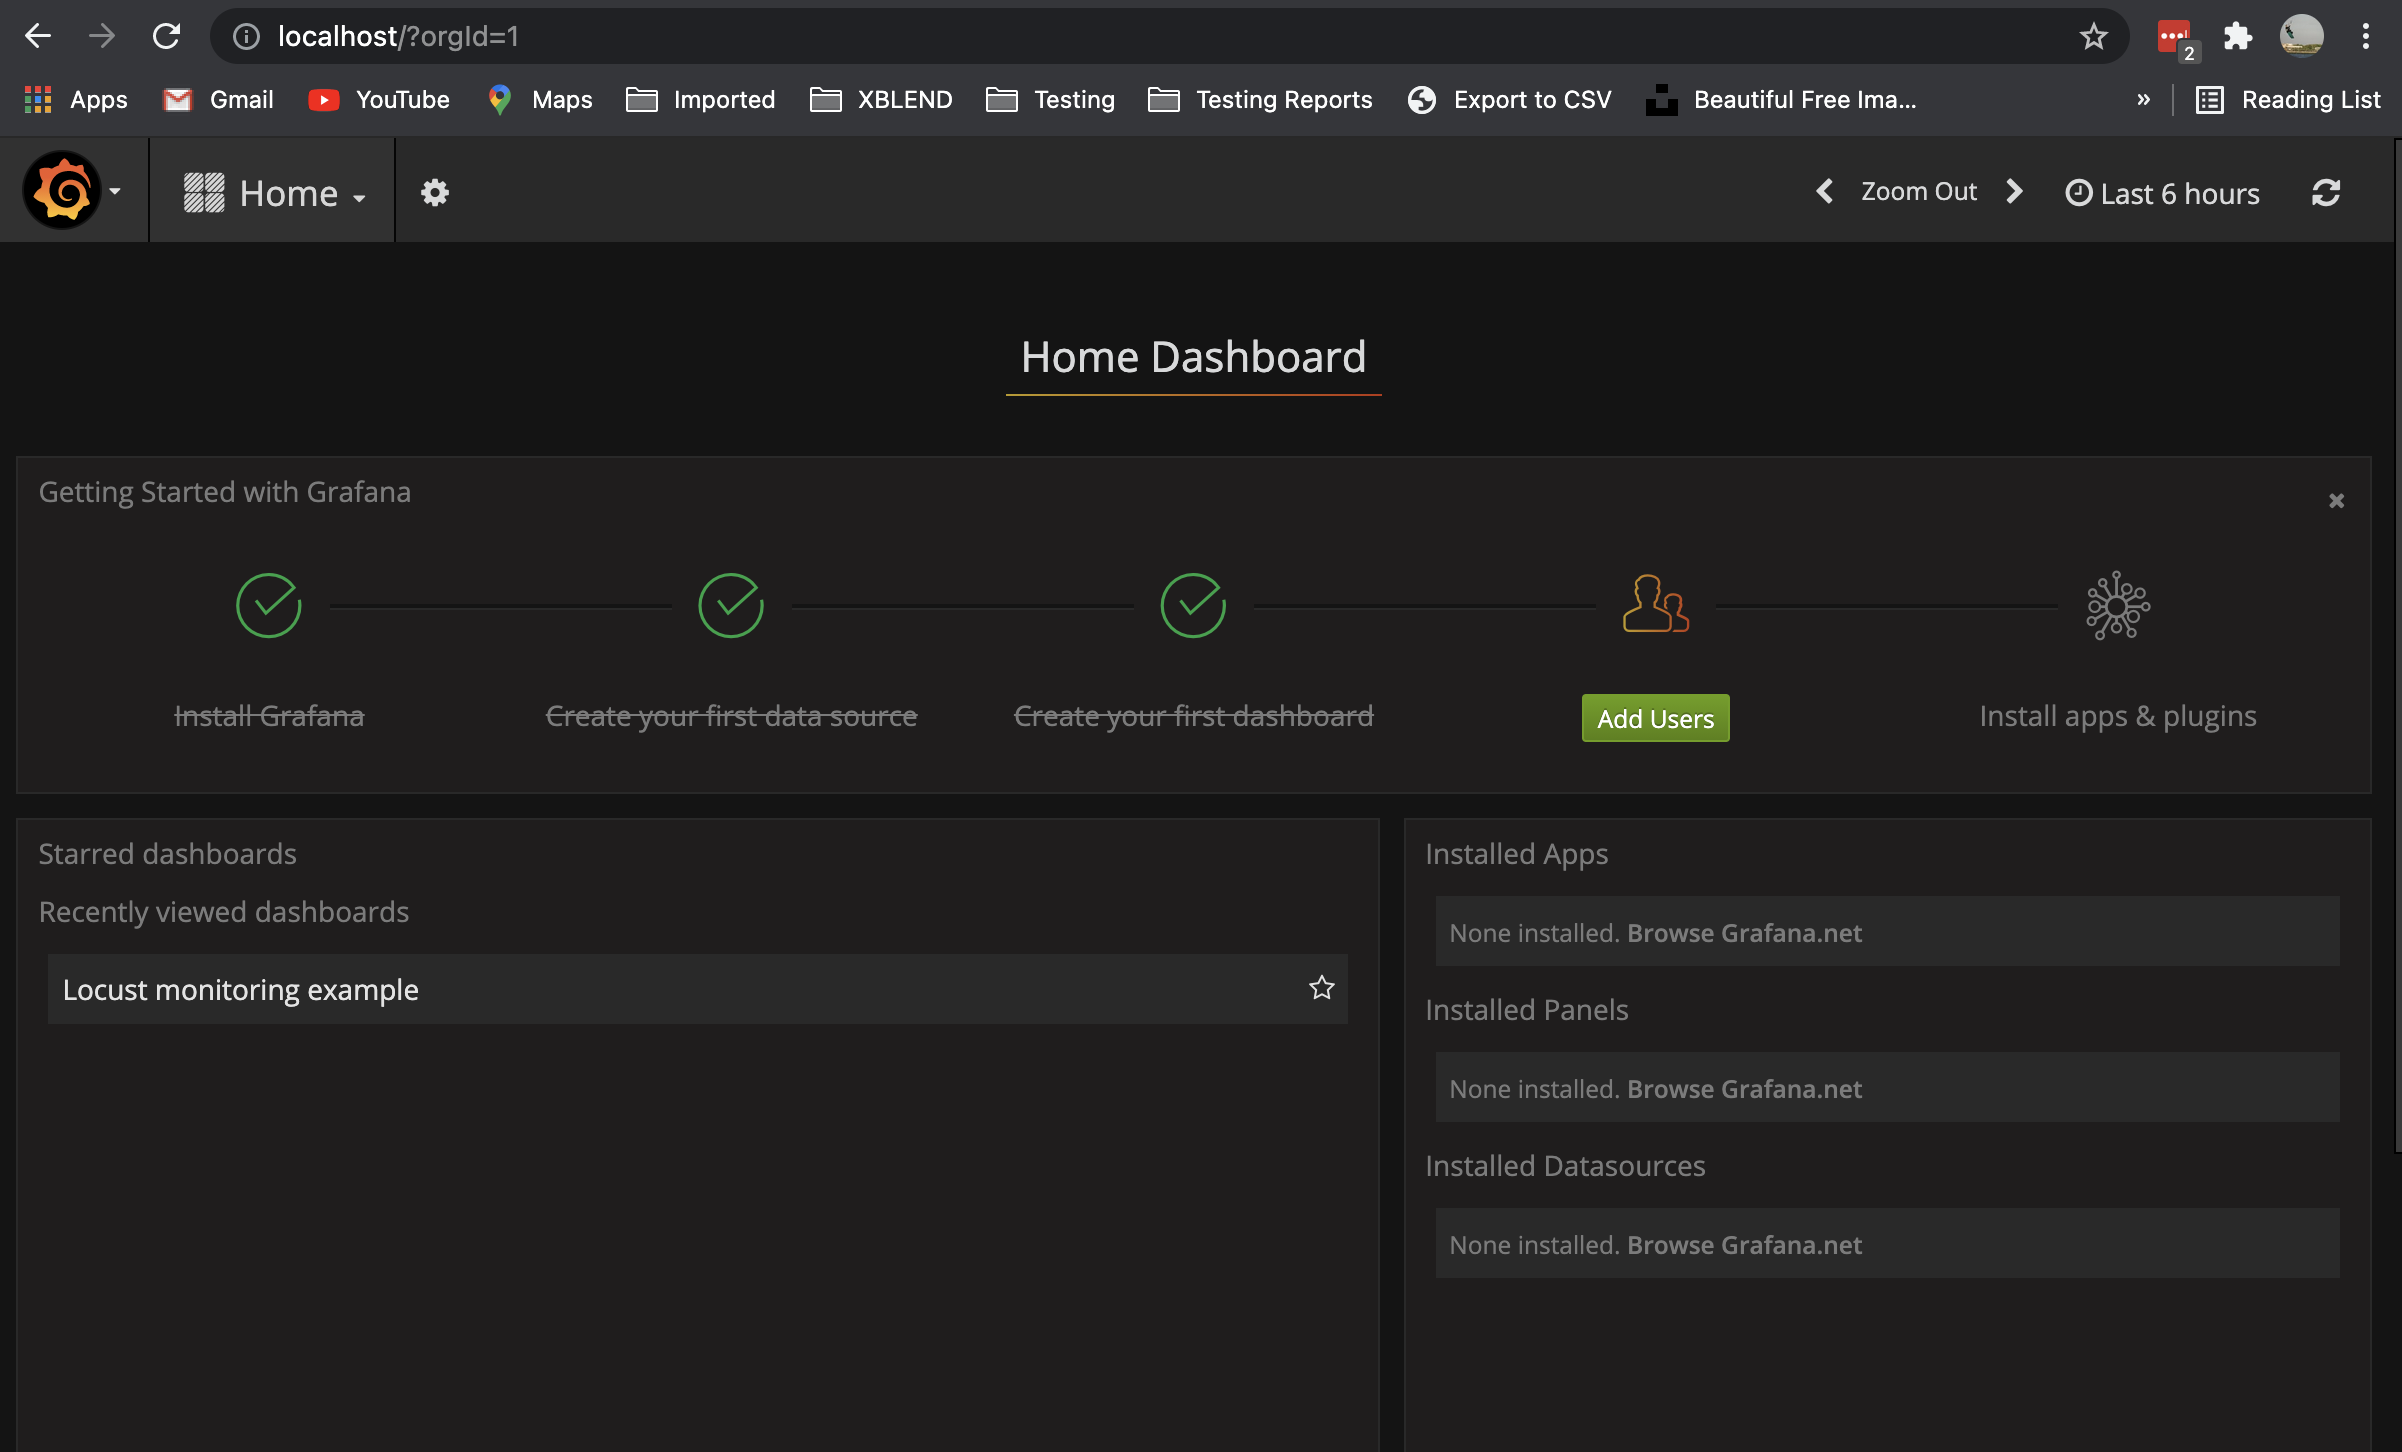
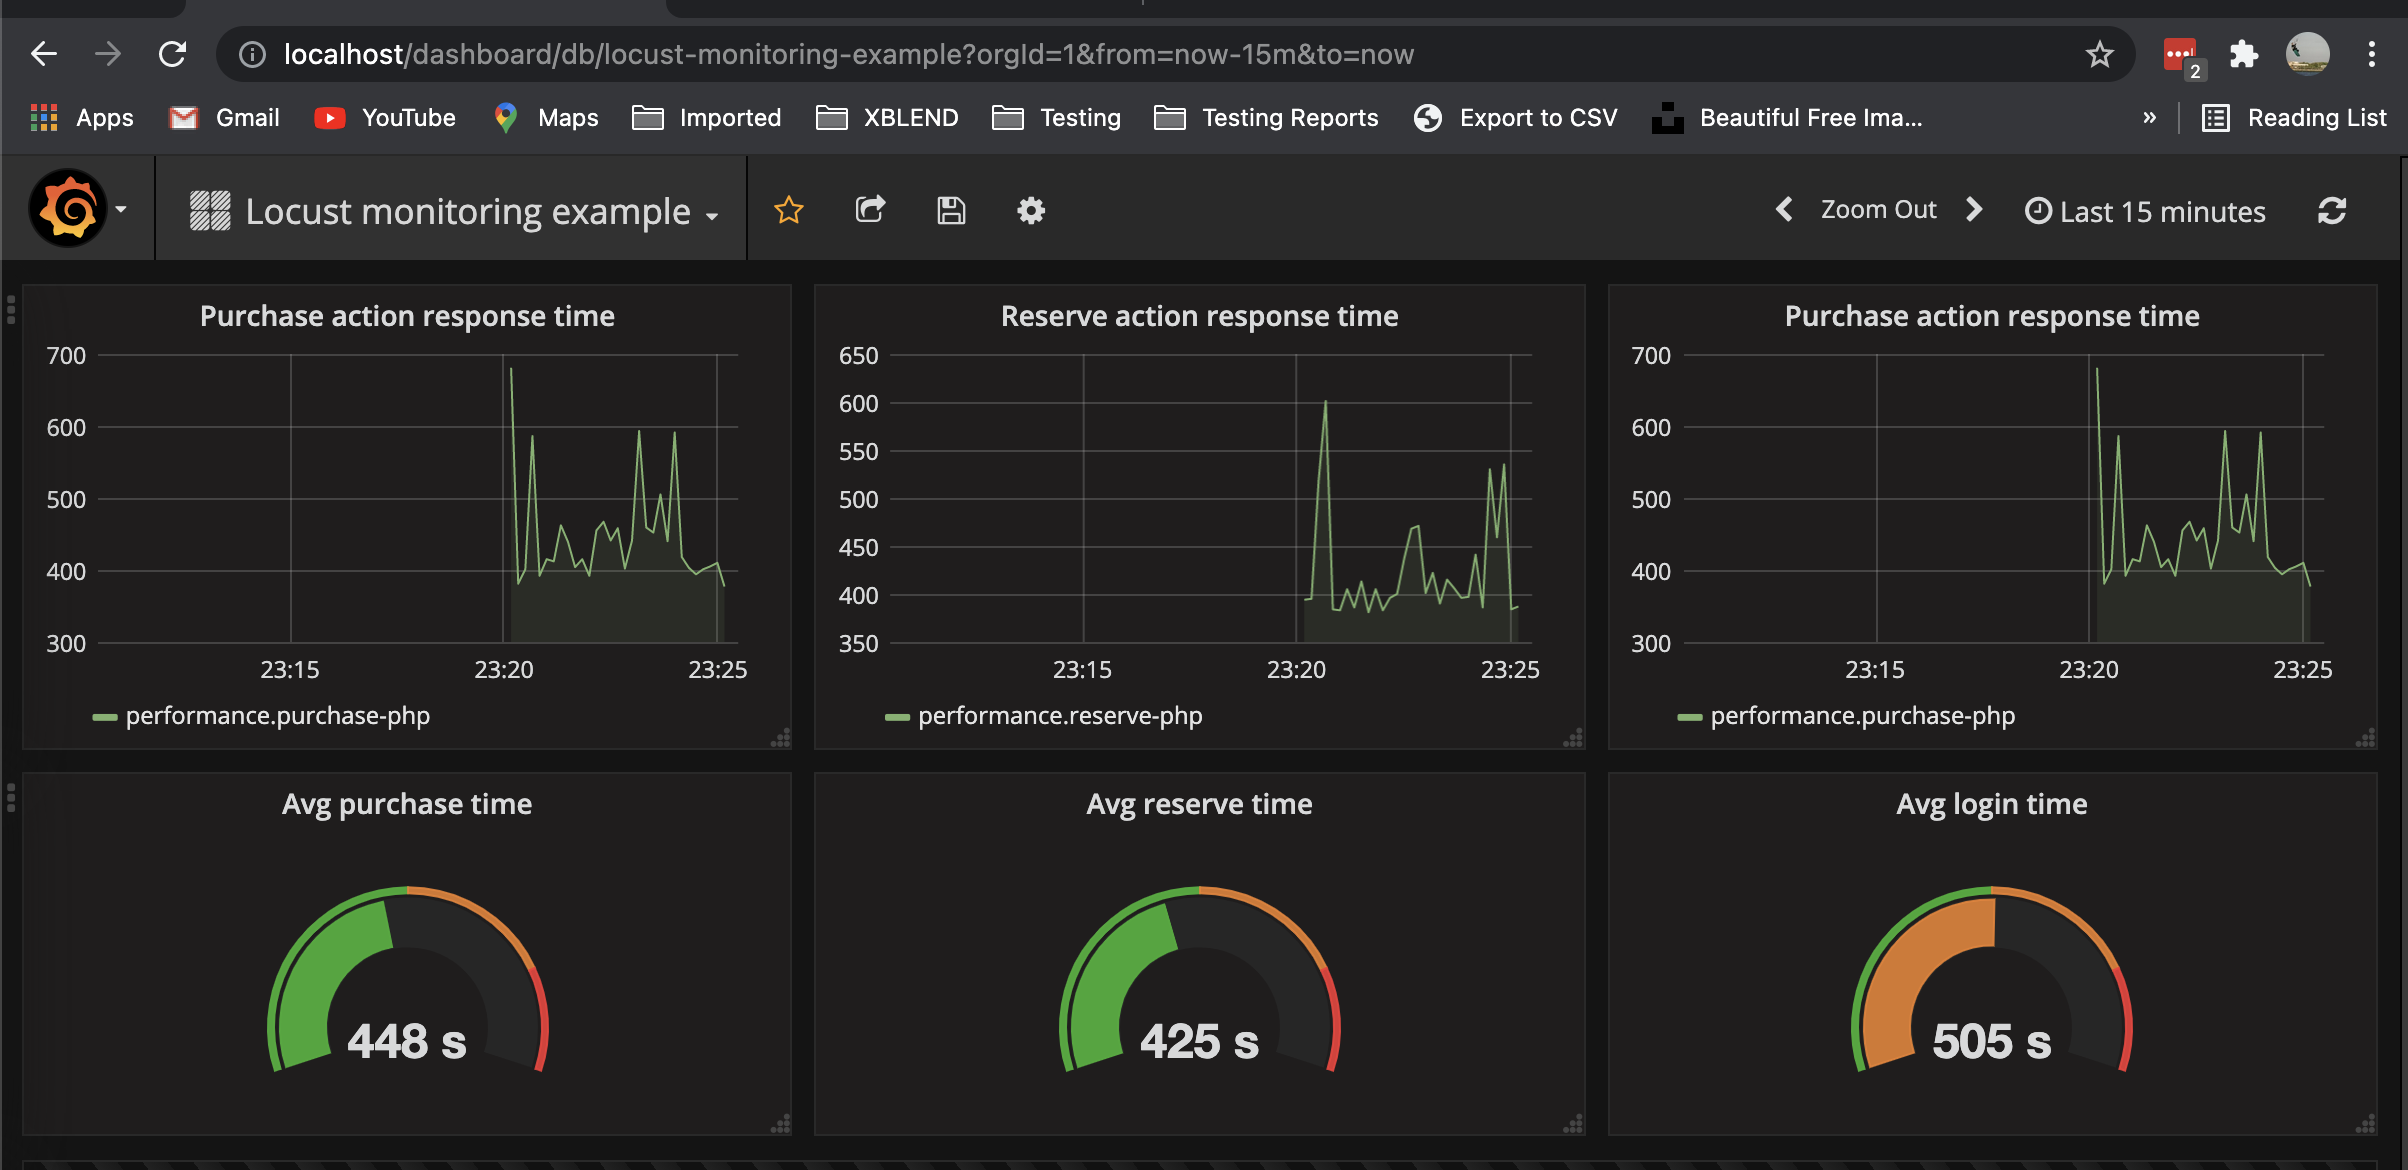
Finally we must add the following template in Graphana to define the dashboard that will enable us to see the execution details, BlazeMeter blog also refers to this template and made it available here. Once it is imported in Graphana it will create a new dashboard.
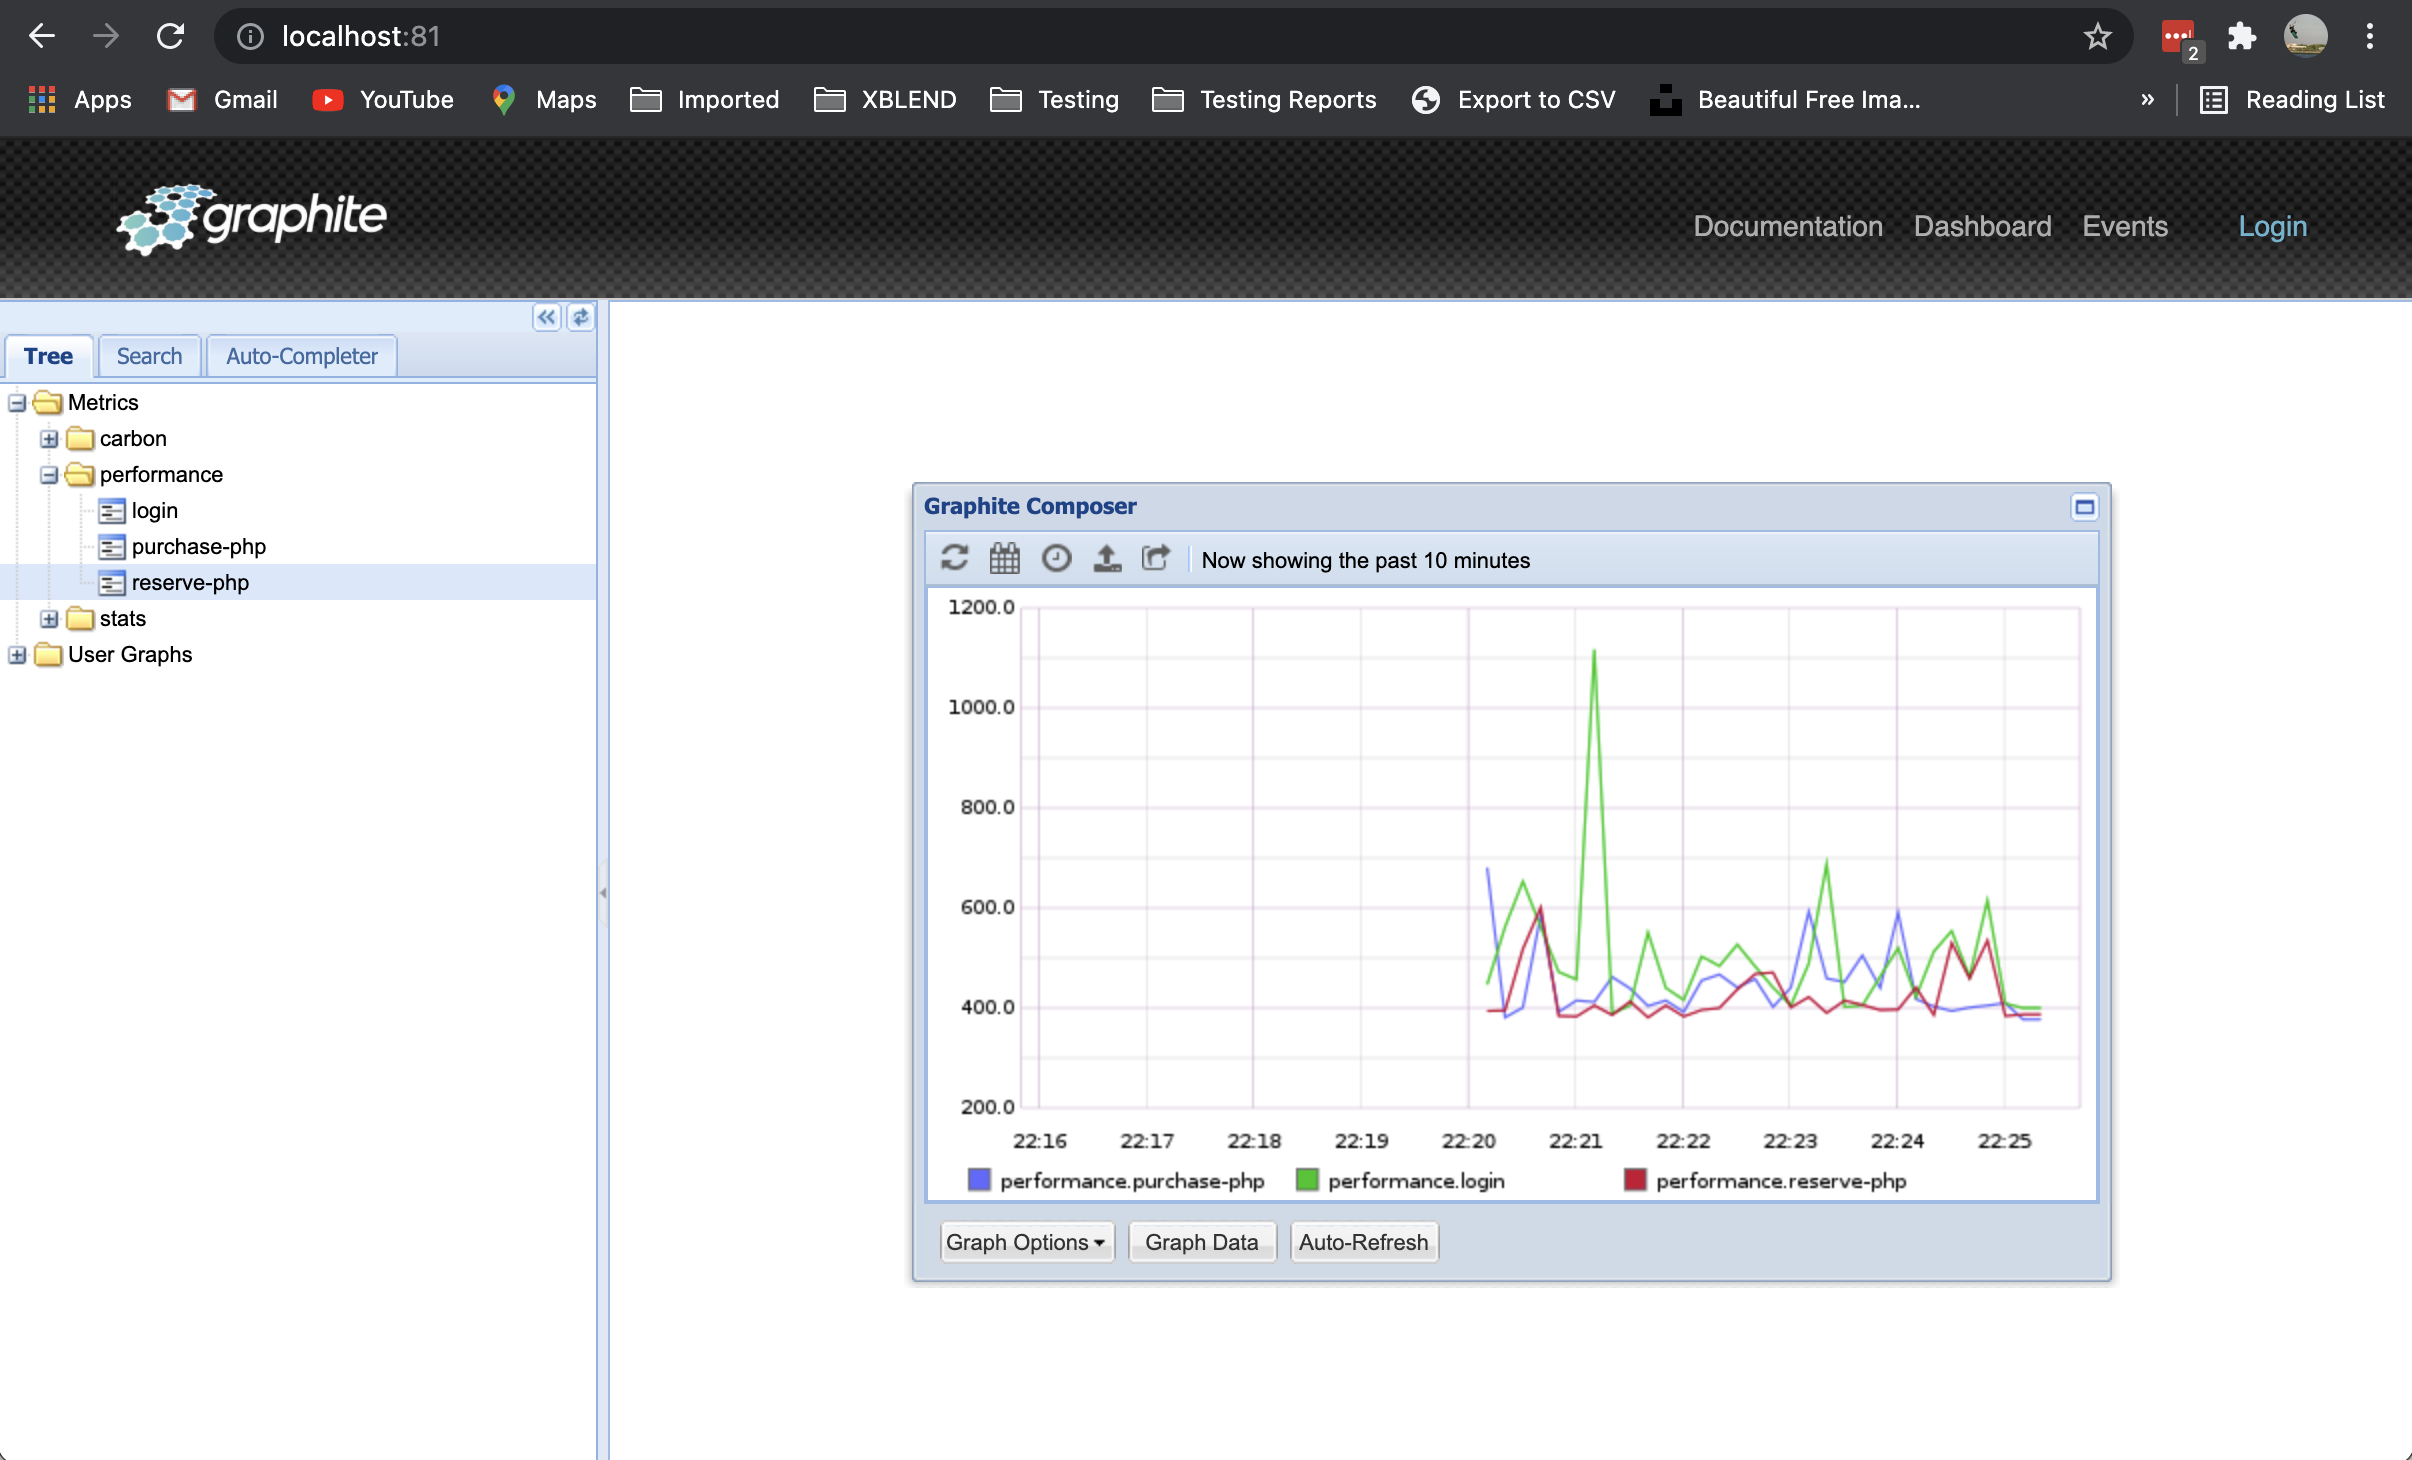
With all of this in place we can execute the tests again and check in Graphana (and in Graphite) all the requests being made:
Notes:
- By default it will execute tests for the 3 browser types available (that is why we are forcing to execute only for one browser)
- By default all the tests will be executed in headless mode
- Folio command line will search and execute all tests in the format: "**/?(*.)+(spec|test).[jt]s"
- In order to get the Junit test report please follow this section
Integrating with Xray
As we saw in the above example, where we are producing Xray Json reports with the result of the tests, it is now a matter of importing those results to your Jira instance, this can be done by simply submitting automation results to Xray through the REST API, by using one of the available CI/CD plugins (e.g. for Jenkins) or using the Jira interface to do so.
In this case we will show how to import via the API.
API
Once you have the report file available you can upload it to Xray through a request to the REST API endpoint for Xray Json.
Xray Json results
The API request we will use, as we have generated an Xray Json report, will be the one to import Xray Json results.
curl -H "Content-Type: application/json" -X POST -u USERNAME:PASSWORD --data '@xrayResults.json' 'http://YOUR_SERVER_URL/rest/raven/1.0/import/execution'
With this command we are creating a new Test Execution that will have the results of the Tests that were executed.
Once uploaded the Test Execution will look like the example below
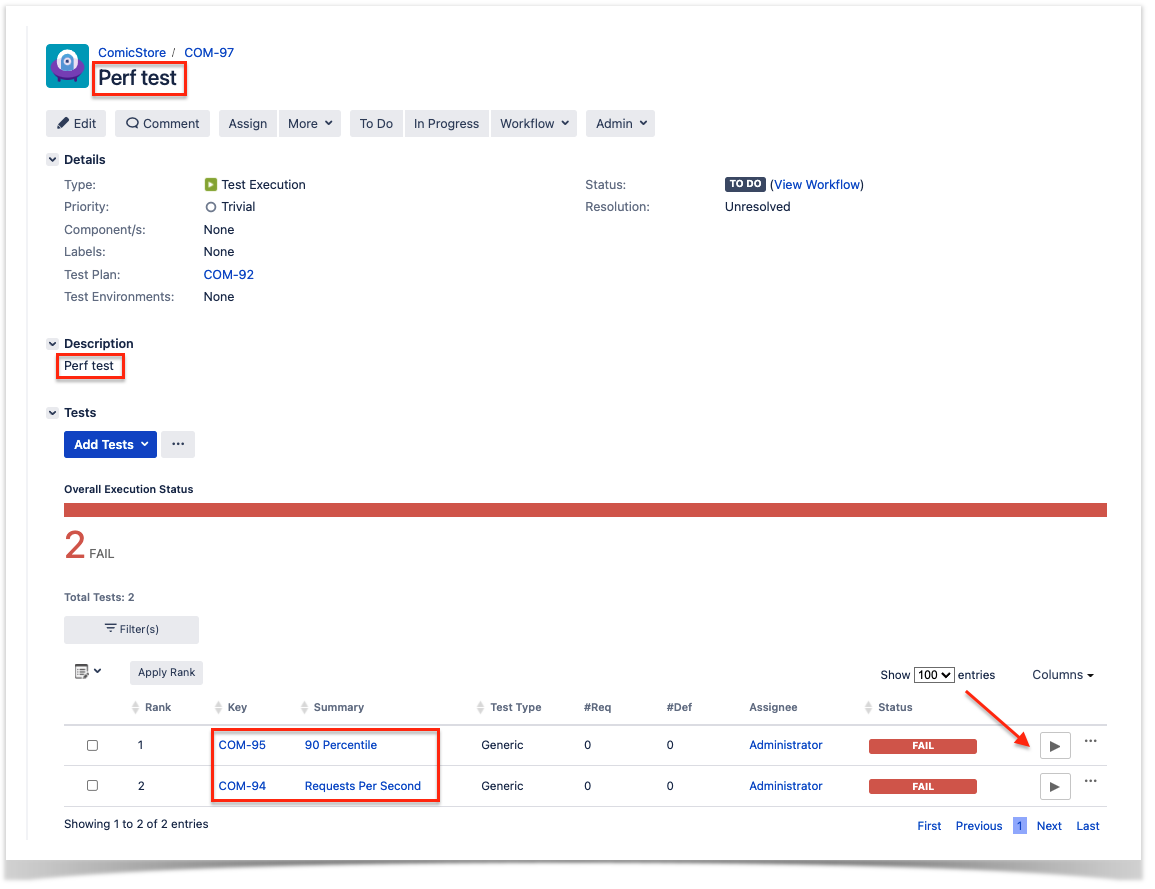
With Title and Description we have defined in the code and linked to the Tests we have created beforehand to hold Performance results.
In order to check the details we click on the details icon next to each Test (below the red arrow in the screenshot), this will take us to the Test Execution Details Screen
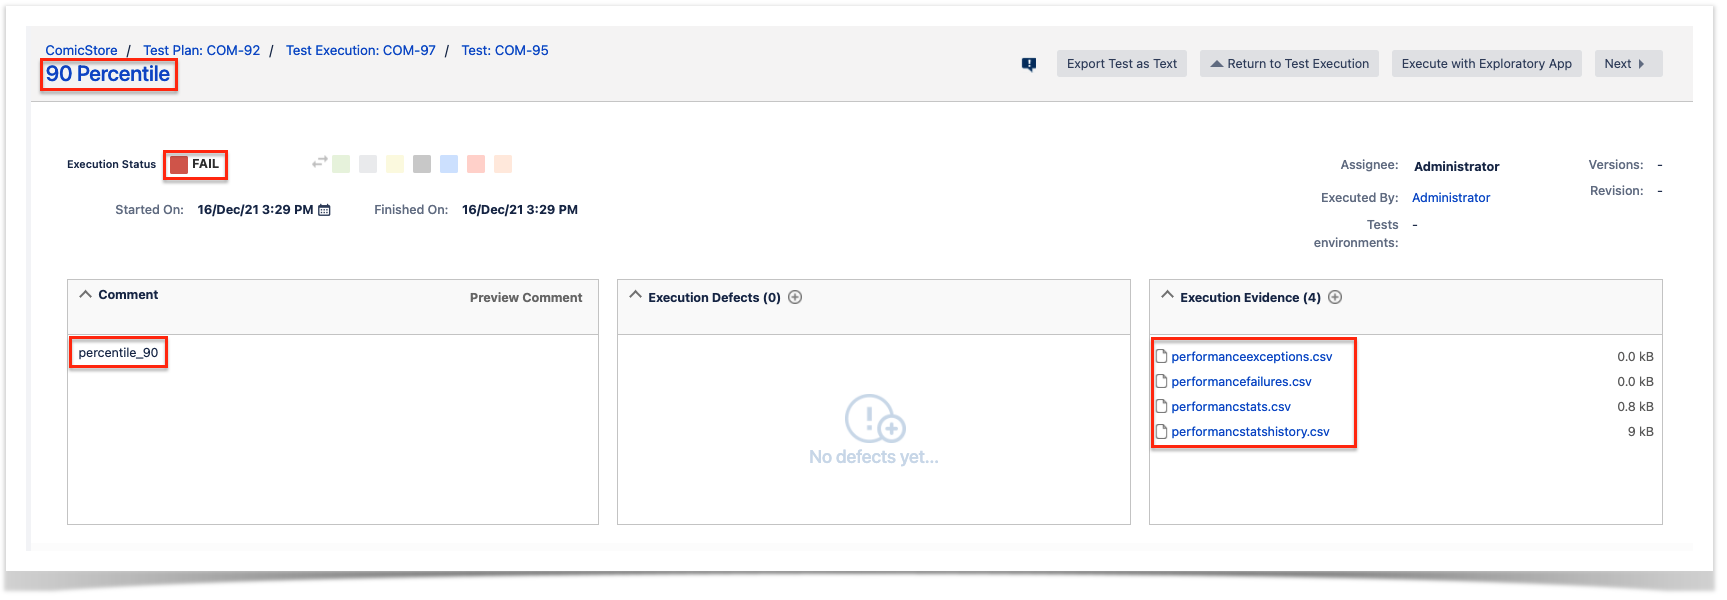
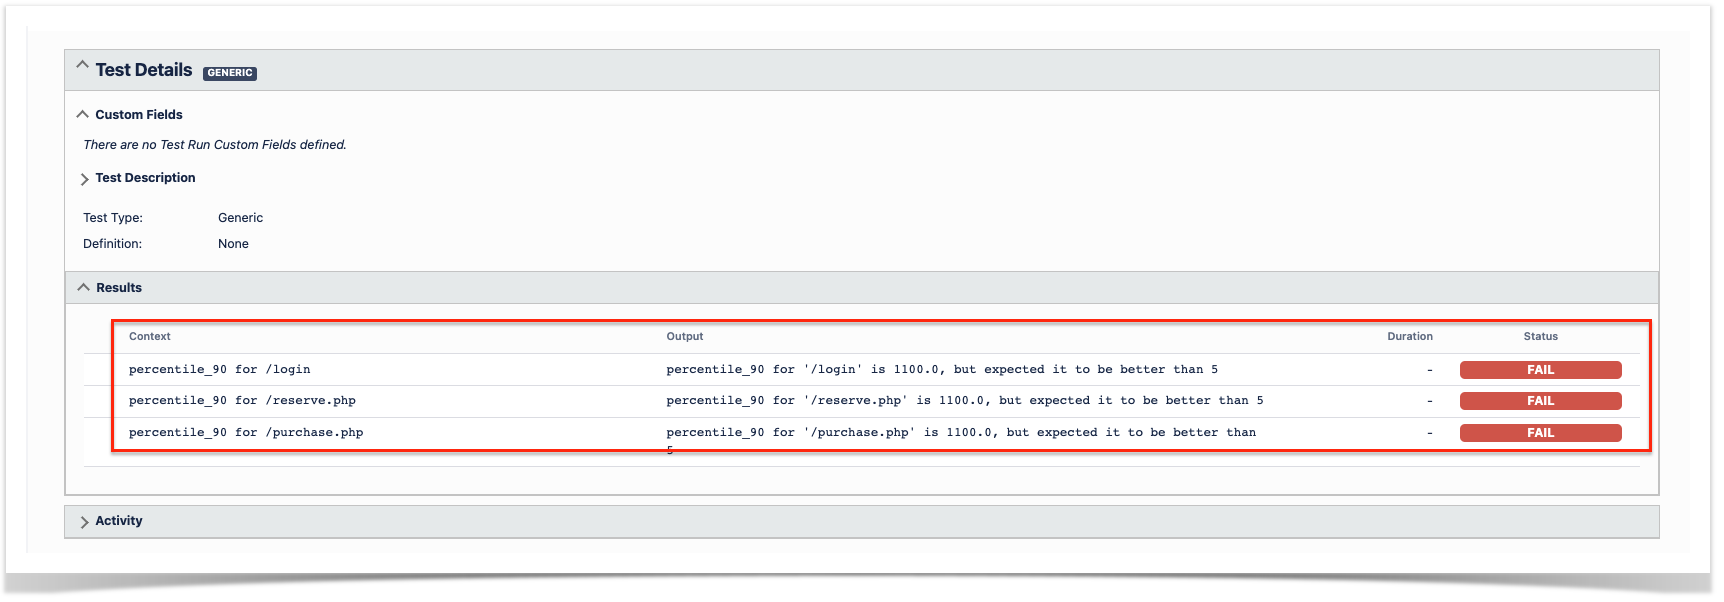
In the details we have the following relevant information:
- Execution Status - Failed, this indicates the overall status of the execution of the P90 Performance Tests
- Evidence - All CSV files produced by Locust to help understand the failure are added as evidences for future analysis
- Comment - Shows the performance indicator we are validating
- Results - Detailed results of each endpoint validated with information of the KPI's defined and why they were considered failed.
Bringing the information of performance tests to your project will allow a complete view over the Testing process and bring that visibility up front for the team to have all the elements necessary to deliver a quality product.
Tips
- after results are imported in Jira, Tests can be linked to existing requirements/user stories, so you can track the impacts on their coverage.
- results from multiple builds can be linked to an existing Test Plan, to facilitate the analysis of test result trends across builds.
- results can be associated with a Test Environment, in case you want to analyze coverage and test results by that environment later on. A Test Environment can be a testing stage (e.g. dev, staging, prepod, prod) or a identifier of the device/application used to interact with the system (e.g. browser, mobile OS).