
Page History
...
This report is accessible either from the Xray Reports icon on the left sidebar of the project or from the standard Reports icon, which includes other kinds of reports besides Xray.
At the top of the report you'll find several areas related with the report and with the data shown in the report.

- A: Analysis & Scope, for choosing how to analyze the entities
- B: Group by, for defining how to visually group/aggregate items
- C: Filter, for selecting the source data
- D: Visualization information and options
You need to configure the source data (i.e., the requirements) for the chart and how to calculate the requirement status for each one of the requirements.
...
Source "requirement" issues can be directly provided (within section C) using a saved filter or by specific requirement fields:
...
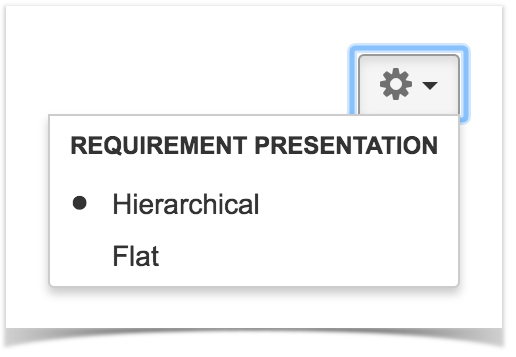
There is also an options menu (section D) where you can choose the visualization type for the report:
- hierarchical - only the parent requirement issues will be presented in the report, if the filter includes them. Sub-requirements can still be visualized in the overall details table.
- flatten - the requirement issues will not consider the parent/child relationship. All parent and child requirements will be considered and showed similarly in the report.
Analysis
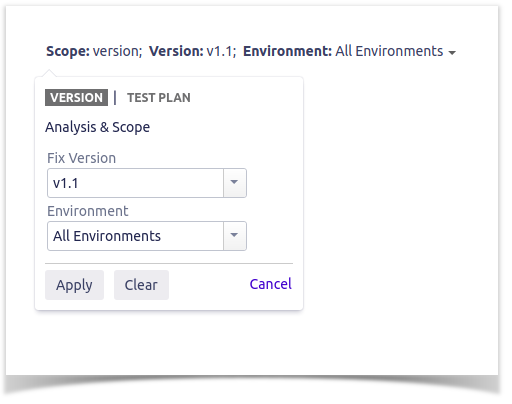
On the left side (within section A), you can define the analysis strategy, i.e., the way you want to analyze the selected/filtered requirements. You can choose either to analyze by Version or Test Plan, and then complement it with a Test Environment.
...
If you specify the Test Environment, then only the executions that ran in the specified environment are considered.
| Info | ||
|---|---|---|
| ||
For more information, please see Coverage Analysis and Understanding coverage and the calculation of Test and requirement statuses. |
...
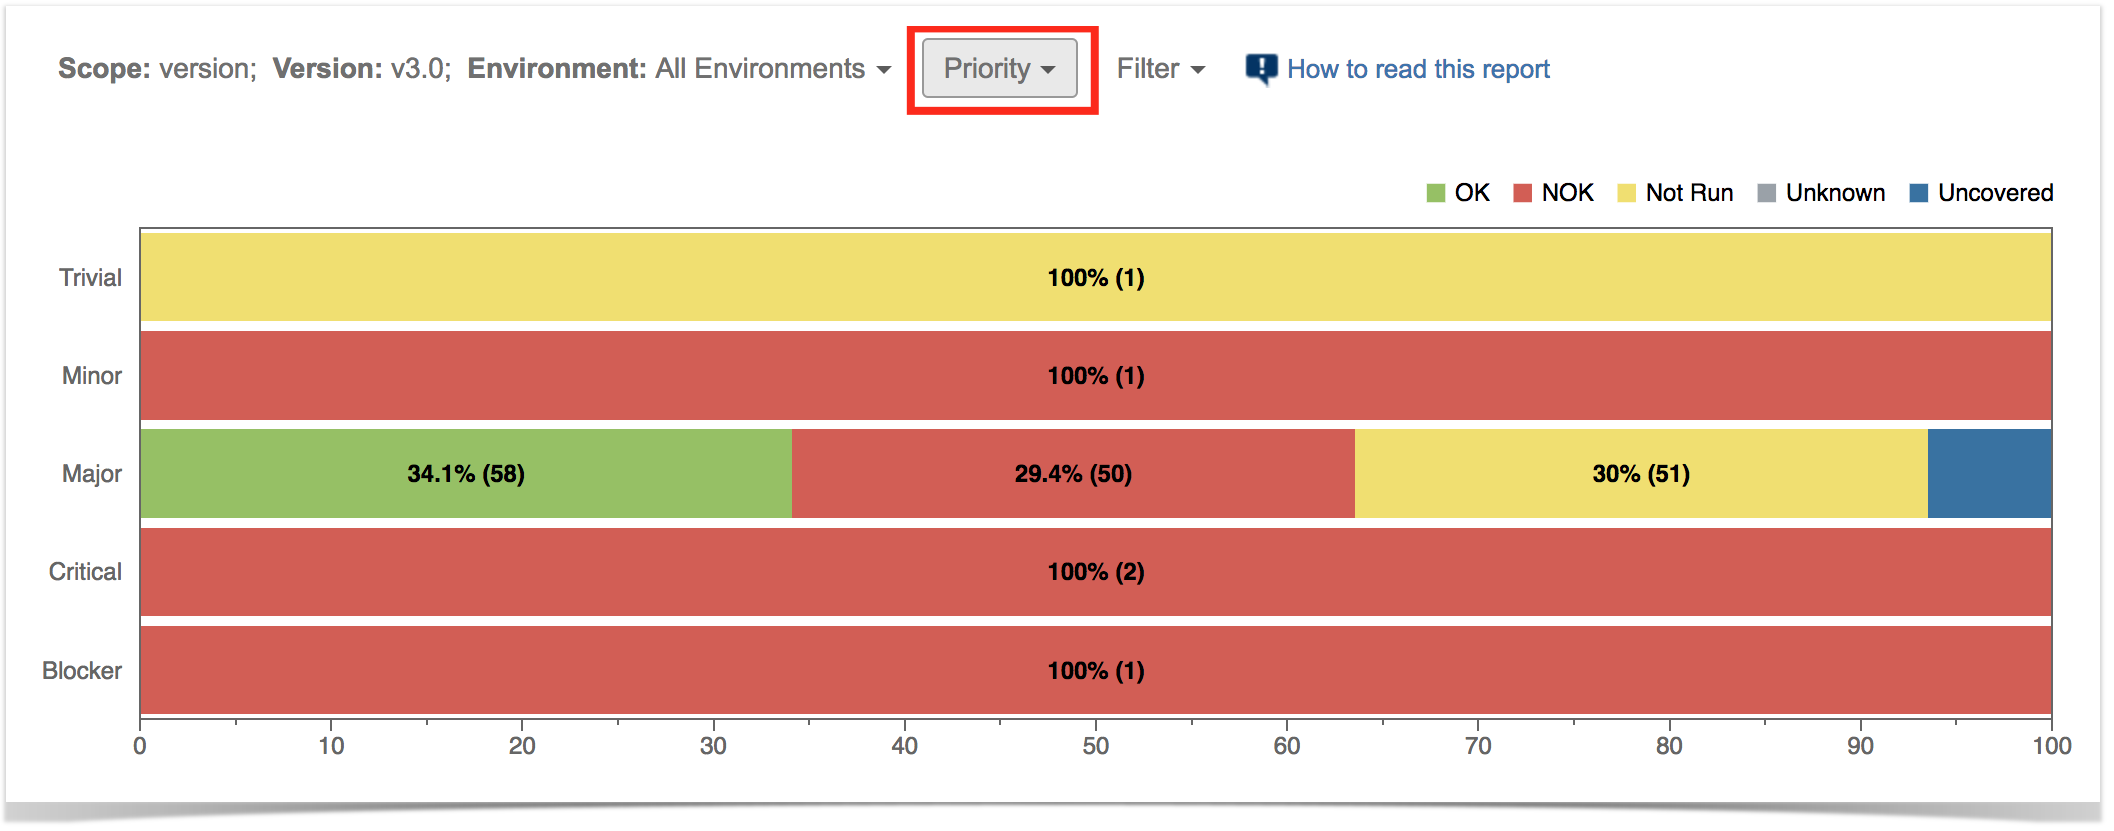
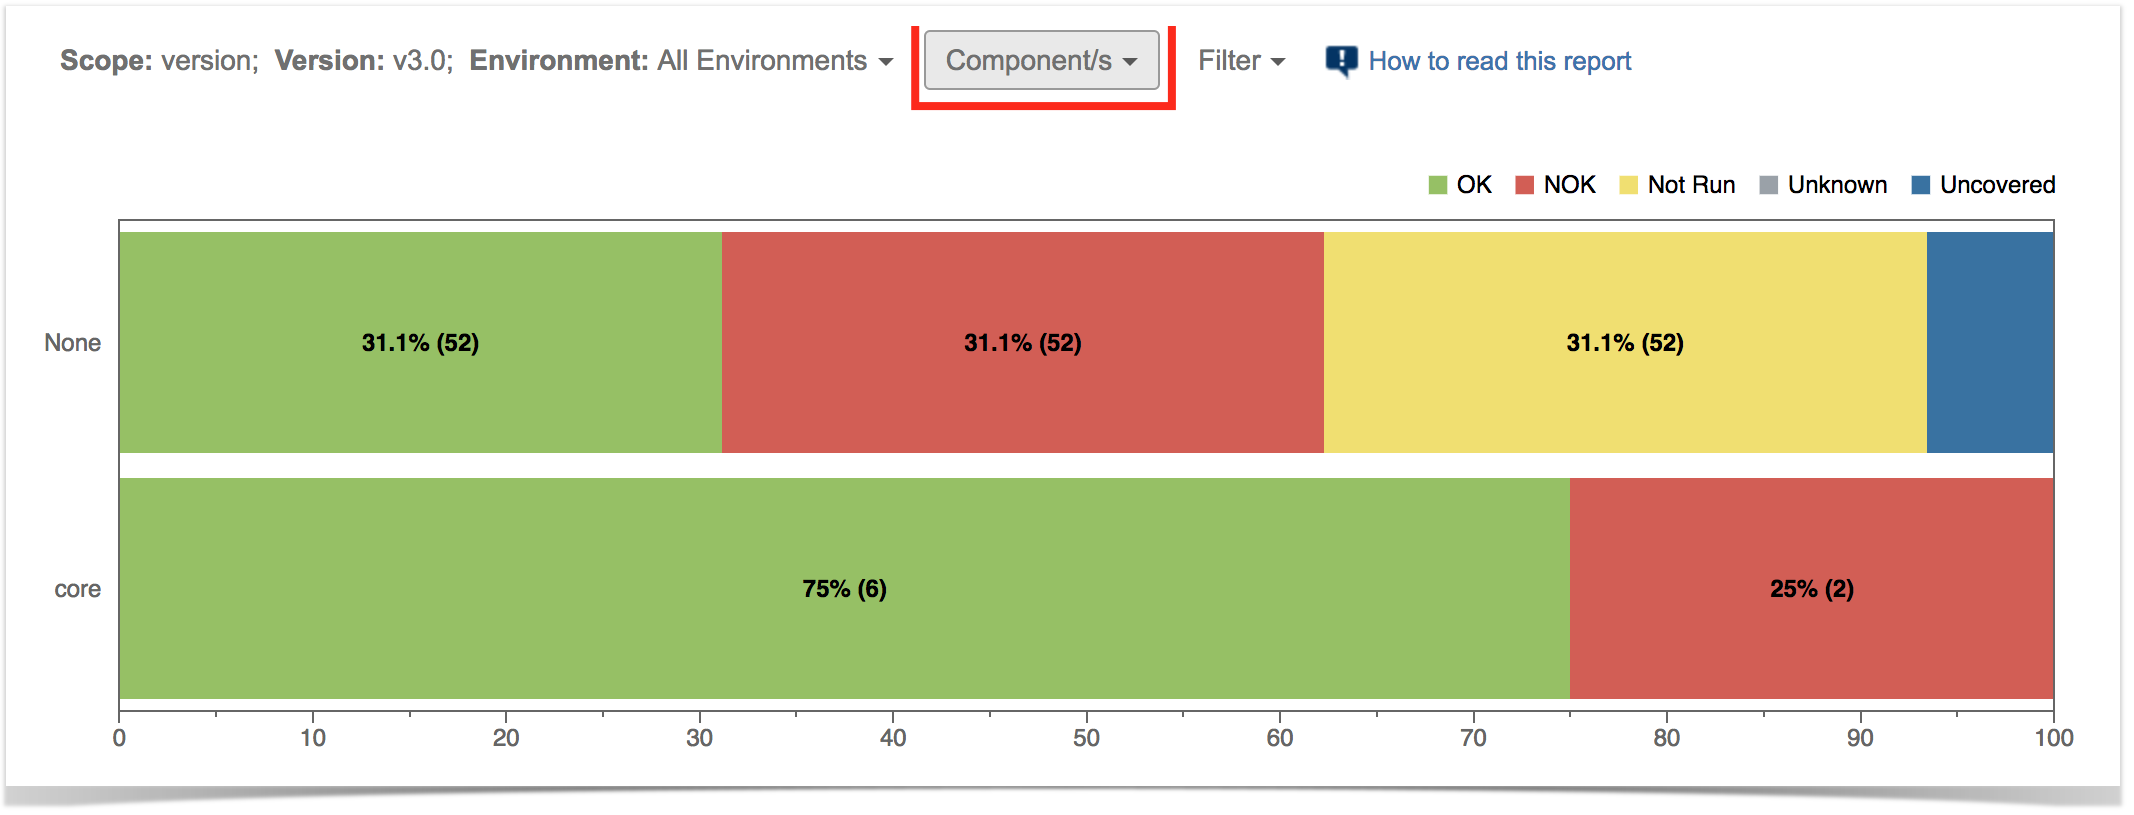
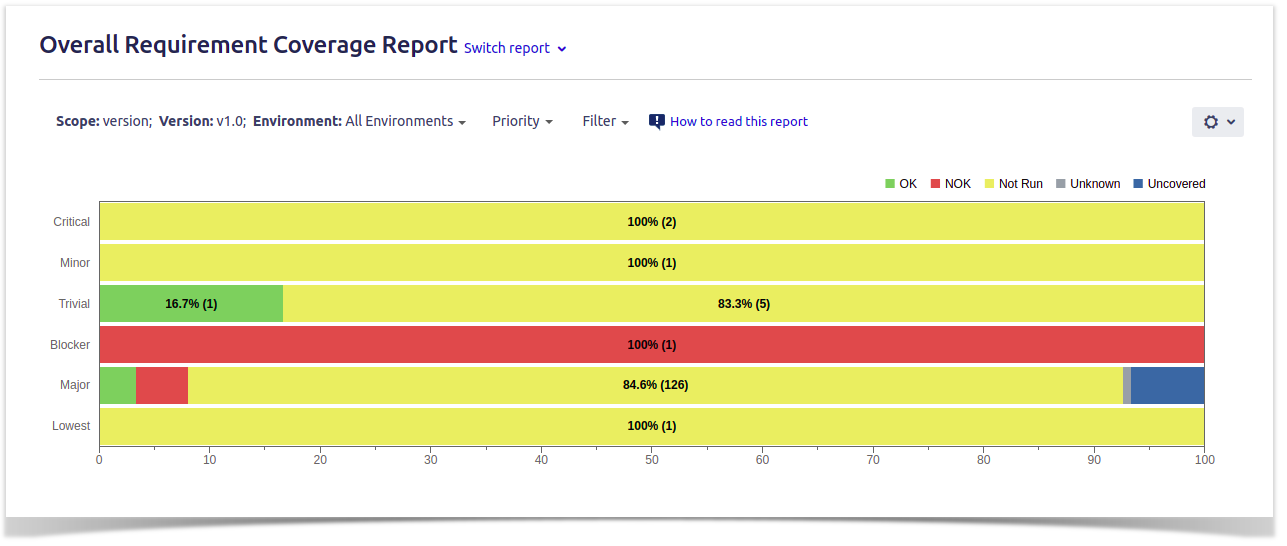
You can visually group the requirements (within section B) by Priority, Component or other fields, so you can analyze requirements from different perspectives.
| Section | ||||
|---|---|---|---|---|
|


| Info | ||
|---|---|---|
| ||
Some Xray global settings may affect the report (e.g."Requirement Coverage Strategy", "Ignore Requirements with statuses", "Ignore Requirements with labels", "Ignore Tests with status") |
...
The Overall Coverage requirements chart is interactive. Hovering over each bar shows a small popup with the information on the specific series (Status, Grouping Field and Percentage). You can deactivate a particular series by clicking it in the series legend.

The chart also supports drill-down. When a section is selected, a table appears below the chart with the Requirement issues.
...