
Page History
...
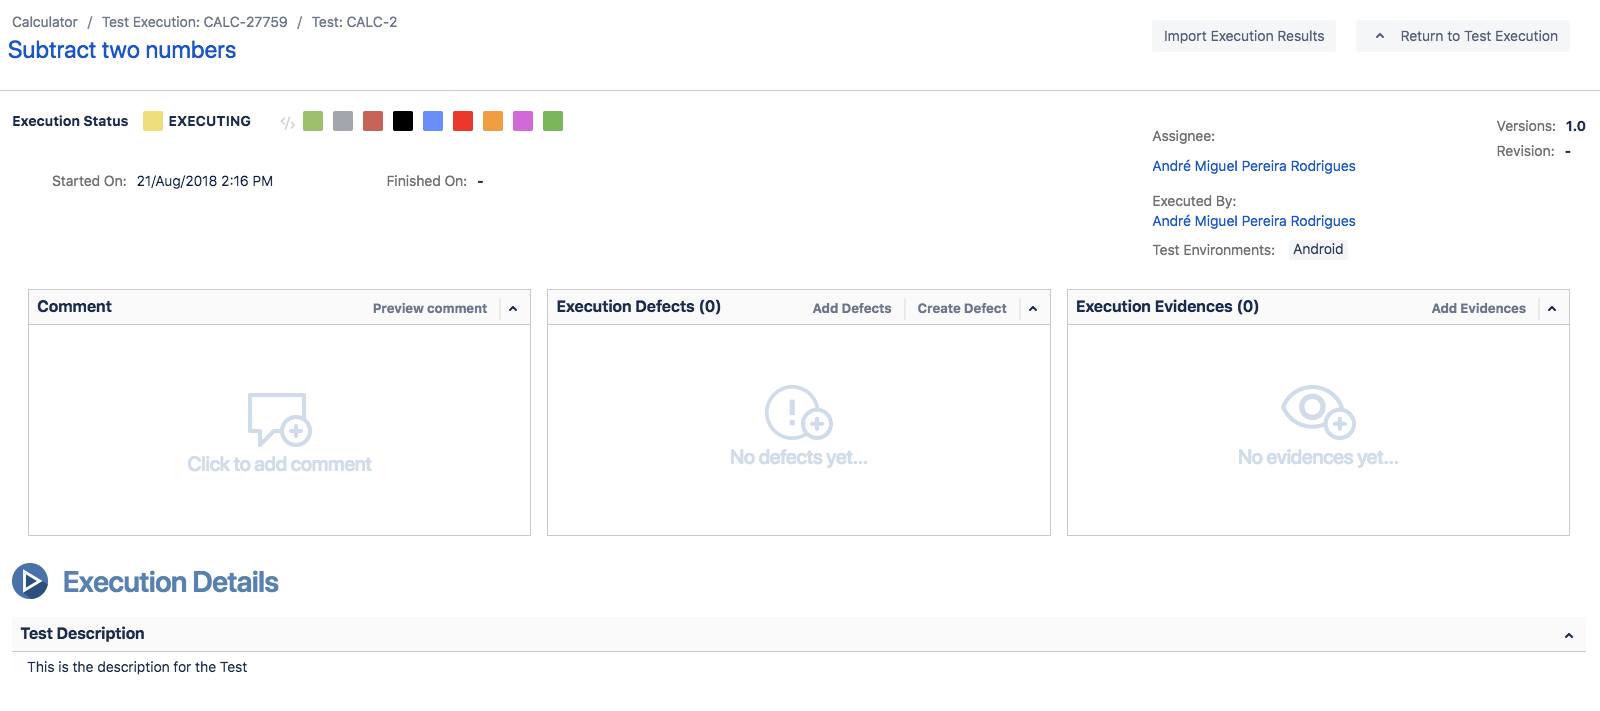
When you execute a Test, the Xray Execution Screen is shown. This screen is accessible from the Test Execution issue view page and the Test issue view page (Test Runs section), and this is where the execution results are displayed and registered. This page contains information about the Test definition and the Test Execution issue context to allow you to execute the Test without exiting this page.
The execution screen is composed of the following divide in 5 sections. The first one is Navigation and Actions bar, then the Execution Status and General Information, after that the Findings section, the Test Details and Activity sections:
- Navigation and Actions bar
- Execution Status and Test Execution fieldsCommentsGeneral Information
- Findings
- Test issue details
- Custom Fields
- Preconditions
- Test Details
- Test Description
- Test Issue Attachments
- Test Issue Links
- Parameters
- Preconditions
- Steps/Definition/Scenario or Scenario Outline
- Iterations
- Activity


Navigation and Actions bar
...
On this bar, you can also find actions to Export test definitions and Import execution results. This is useful if you need to do an ad-hoc execution for an automated Test. Usually, automated tests are executed in a Continuos Continuous Integrating platform and the results are imported automatically into Xray (creating new Test Execution issues for the results) but you can also execute each automated Test individually and import the execution result.


Export to Cucumber
...
If you already have the test results, just use this action to import the report files into Xray and update a specific Test Run.
Dataset
If you want to edit a test run dataset, you can do it by clicking on the Dataset button. To learn more about it click on Parameterized Tests.
Exploratory App
If your test is an unstructured test, that option will appear and if clicked the Exploratory app will open. To learn more about it click Exploratory App.
Execution Status and General Information
The Execution Status describes the current Test progress. The possible (native) status for a Test Run are TODO, EXECUTING, FAIL, and PASS. You can also create custom statuses in the Xray Test Statuses Settings global page.
...
The status section contains other relevant fields such as:
- Timer - The time elapsed since the last time the timer started and the total time logged into this execution
- Assignee - the User assigned to perform the current test execution
- Executed By - the last User that changed the status of the current test run
- Versions - the target release version tested by the current test execution
- Revision - the source code and documentation version used in the current test execution
- Started On - the date and time the execution of the current test started
- Finished On - the date and time the execution of the current test finished


You can change the Test Run assignee directly on the field. It supports inline editing and once activated, you can filter by user and then select the one you want to assign to the Test Run.


| Info |
|---|
After assigning a Test Run, an email notification is sent to the new assignee if the corresponding setting is enabled in the Global or Project Settings. |
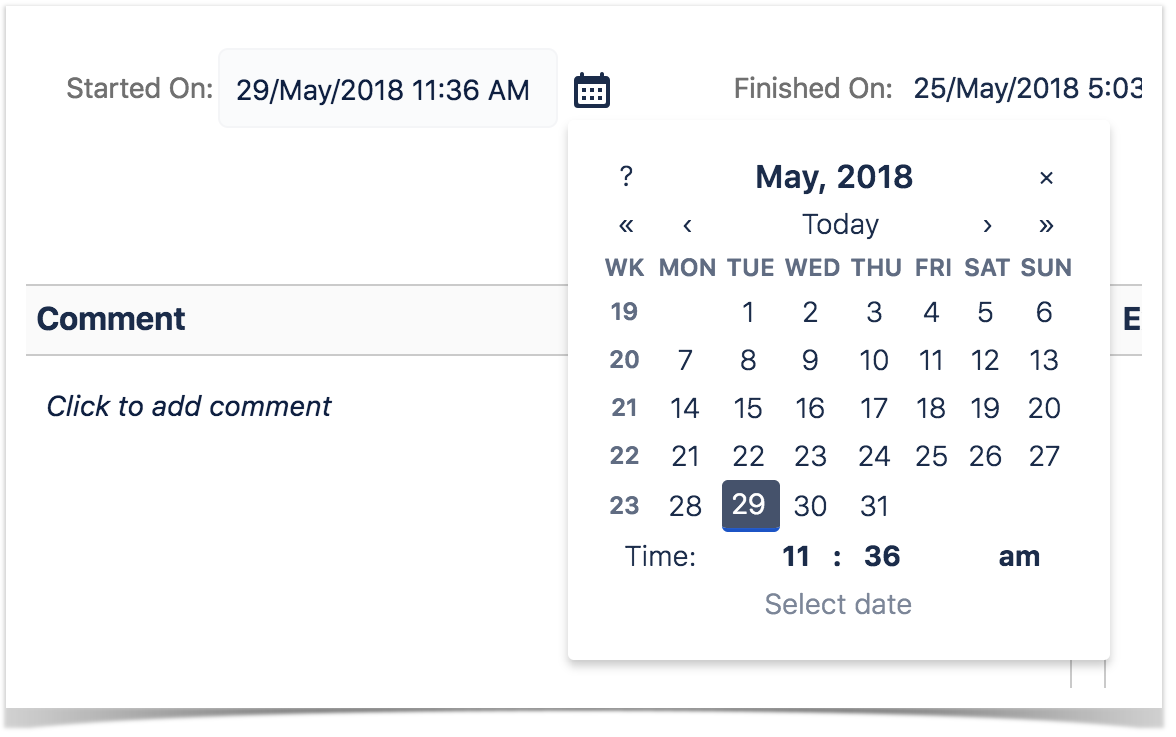
If the dates are configured to be edited, you can edit the Started On date by clicking the calendar icon and choosing the date and time. You can check your configurations by going to Jira Administration > Add-ons > Miscellaneous.
Comment
This field is inline editable so you can input comments about the current execution without reloading the page.
It supports the Jira markup wiki language.

...

Timer

The timer is used to help the user track the time spent in the execution of the test.
This component will only be visible if the corresponding setting is active in the project settings.
The timer itself can be started, paused and reset manually using the button to do so:
You can also edit the value on the timer by clicking on it if the Set the value of the Time Tracker setting is active in the project settings.
The timer will also automatically start when the status of the Test Run changes to Executing and it will pause when it changes to a final status (i.e. Passed, Failed), it will also reset when it the Test Run changes to Todo.
Below the timer there is a component that tracks the time logged for this execution:

By clicking on it, you can log more time into it:
Time added in this dialog will be added to the work log of the respective Test Execution:
Findings
This section is where the Defects, Evidences, Comments and Custom Fields added are displayed.


Defects
This field lists the overall and step defects related to the current execution. It is possible to Create new Defect issues (or sub-tasks) or Add existing Defects by clicking the respective option.

Group Defects
"Show Steps Defects" is an option that you can see in Manual tests, that allow you to see overall defects and defects associated with steps in the same panel.
This feature is optional and you can enabled/disabled it on the respective panel section.
Example:
When the toggle is on, both defects appear in the panel and a label (Global/Step/Iteration + Step) is shown at the start of the defect line to easily distinguish each of them.

...
When turned off, only the overall defects are shown.
Show Steps Defects |
|---|
Toggle On
|
Toggle Off
|


Evidence
This field lists all the attachments related to the current execution. Clicking Add Evidences opens Evidence opens up the Attach Files dialog box. Check here for more information about attachments.


Issue Details
This section includes some fields present on the Test issue. It often contains useful information for testers to execute the Test.
Test Description
This section includes the current Test issue description. It often contains useful information for testers to execute the Test.
This field supports the Jira markup wiki language.

Test Issue Links
This section shows all links associated with the Test.

Test Issue Attachments
This section shows all attachments associated with the Test.
...
Group Evidence
"Show Steps Evidence" is an option that you can see in Manual tests, that allows you to see overall evidence and evidence associated with steps in the same panel.
This feature is optional and you can enable/disable it on the respective panel section.
Example:
When the toggle is on, all evidence appears in the panel and a label (Global/Step/Iteration + Step) is shown at the start of the evidence line to easily distinguish each of them. When turned off, only the overall evidence are shown.
| Show Steps Evidence |
|---|
Toggle On
|
Toggle Off
|


Custom Fields
You define additional custom fields for Test Runs. These fields can be useful to add extra information to Test Runs, usually only available when or after executing Tests.
...
If there are any custom fields defined for the scope of the Test Run, they will appear on the "Custom Fields" section.
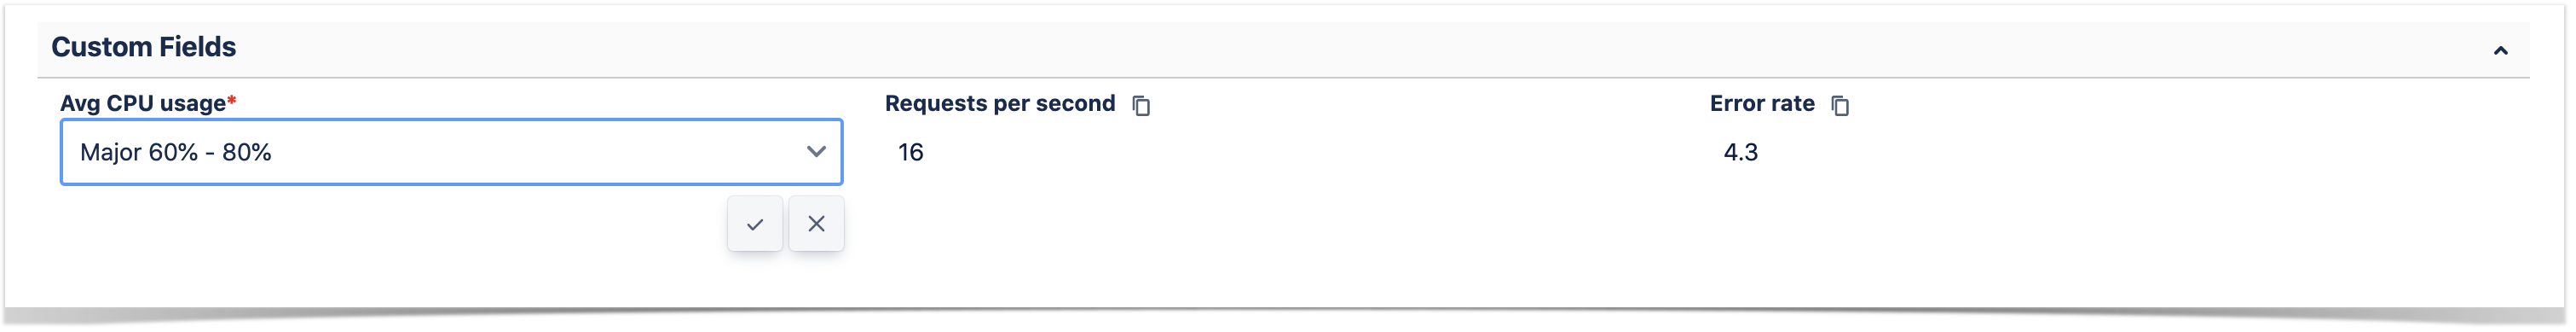

It is also possible to define custom fields that are mandatory. If this is the case, users will not be able to set a final status on the Test Run if there is any required custom field that is not populated.

Comment
This field is inline editable so you can input comments about the current execution without reloading the page.
It supports the Jira markup wiki language.

Test Details
This section includes some fields present on the Test issue. It often contains useful information for testers to execute the Test.
Test Description
This section includes the current Test issue description. It often contains useful information for testers to execute the Test.
This field supports the Jira markup wiki language.

Test Issue Attachments
This section shows all attachments associated with the Test.

Test Issue Links
This section shows all links associated with the Test.

Parameters
This field shows the parameters' values defined in the dataset when there is only a single row in it. To learn more about it click on Parameterized Tests.


Preconditions
This field shows the Preconditions issues associated with the current Test.

Test Details

Steps/Definition/Scenario or Scenario Outline
Within that Within the Test Details section, you will find the Test script to execute. Depending on the Test Type, this section can display Test Steps, a Generic Definition field (for manual Tests), Definition (for unstructured Tests), and Scenario or Scenario Outline (for Gherkin scenarios).
Manual Test Step Results Table
A Manual Test execution screen contains the Test Steps, with the Action, attachments and all the other configured fields to be used as a reference while testing. The Test Steps field configuration used is the one defined in the Test Run's Test project.
...
Note: Changing the Status on each Step will affect the Execution Status field on the Execution Screen.

Gherkin
...
Tests
Gherkin Tests always display the Test scenario on the execution page. Usually, these tests are automated and their result can be imported into Xray. However, it is also possible to execute these Tests manually by setting the overall result of the Test Run, or by setting the result of each example (in case of scenario outlines).


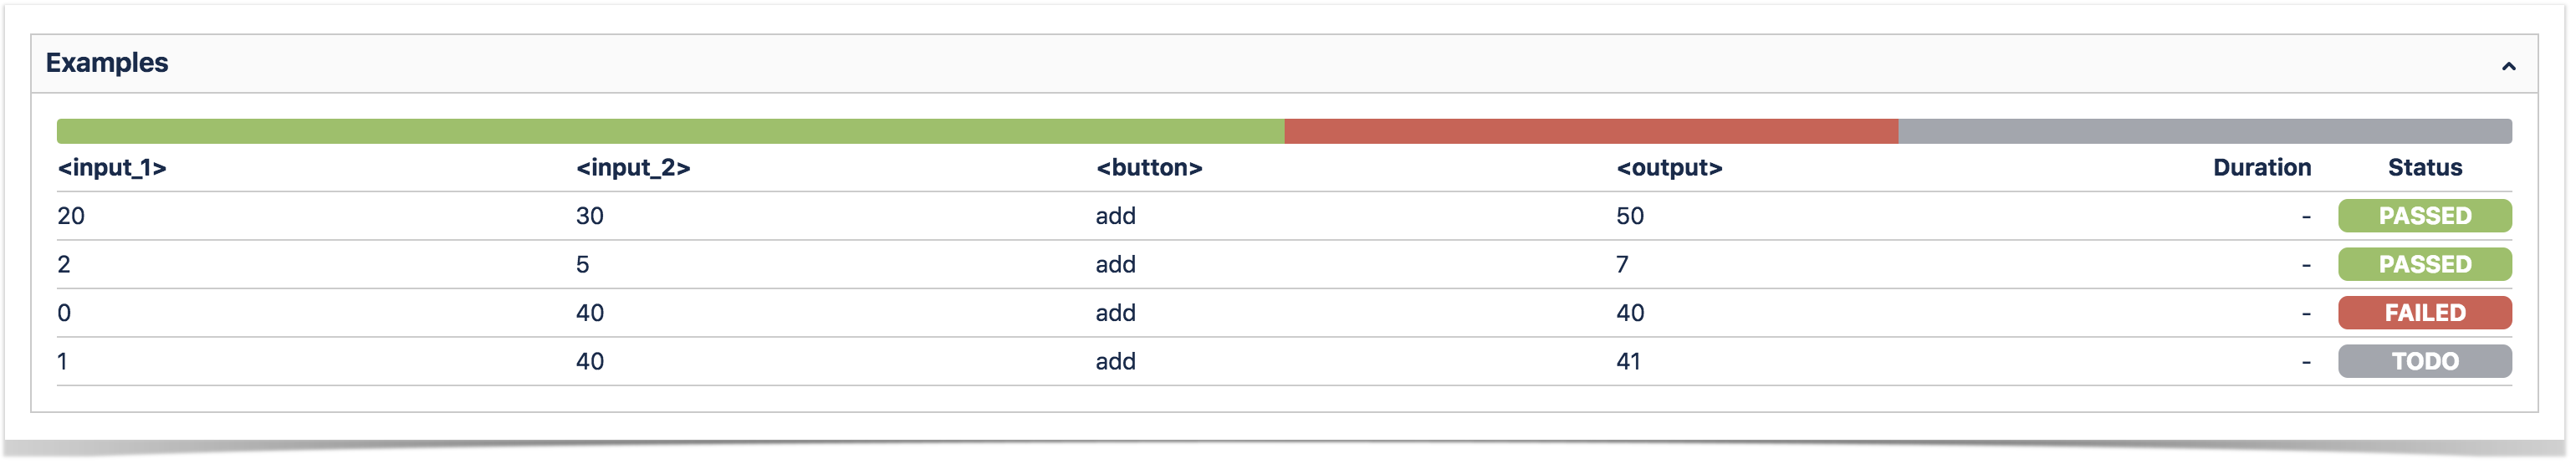
Examples
A scenario outline Scenario Outline contains a table of examples that define several inputs and outputs for the given scenario. Each example is, therefore, a set of values that will be replaced on the scenario.
...
A scenario outline test is TODO if at least one of the examples did not run and all the other examples passed or todo.

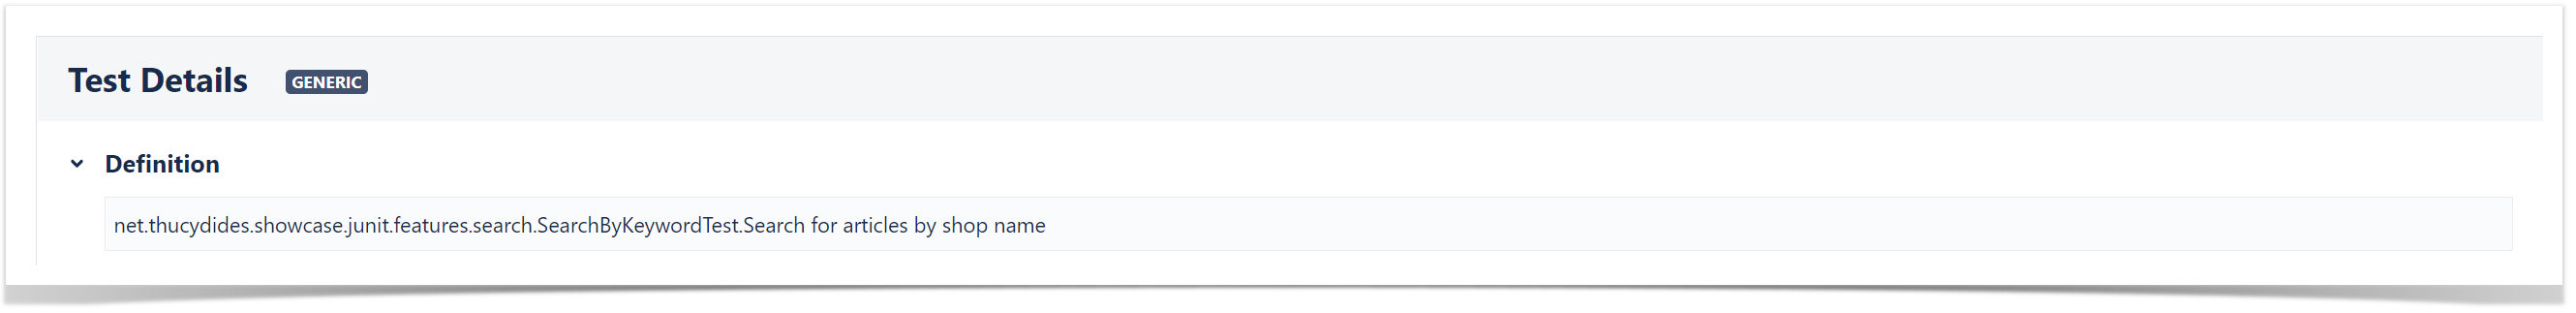
Unstructured
...
Tests
Unstructured Tests only contain the definition field on the Test Details section. This field can specify a test script, an ID to an external (automated) test case, or an Exploratory Test charter. Similar to Gherkin Tests, most unstructured test results will be imported or set by another tool. However, it is also possible to set the status of unstructured tests manually..
Iterations
When this is a test run of a data-driven test, this field shows all the iterations corresponding to the rows of the dataset closest to the test run. For each iteration, the preconditions and steps appear with the expected parameter values for it. To learn more about it click on Parameterized Tests.
All operations for test steps are also available within an iteration, namely adding defects, evidence, and the actual result.
This section also features a progress bar displaying the status of all iterations.
Filtering iterations
It is also possible to filter the iterations by status. A filter button is provided next to the iterations progress bar. Clicking on this button will open a panel with all the available statuses. Choose one or more statuses and press Apply.
Status calculation
When a step status is changed, the iteration status will be updated automatically, according to the step statuses and, in turn, the overall test status will also be updated based on all iterations statuses.


Automated Results
...
- Context: An execution context name (in the case of Xamarin Test Cloud results, the mobile device, and operating system version)
- Error Message: A possible error message if the result has failed
- Duration: The complete duration of an execution result
- Status: The execution results status


Activity
The Activity field lists all the activities related to the current execution.

For data-driven tests the iteration number will appear in the activity list:

Attaching Screenshots
To attach a screenshot, paste the image from your clipboard using the relevant keyboard shortcut. (For Mac OSX, use CMD+V; for Windows, use Ctrl+V.)
...
When a Test definition has changed, a new dialog box will appear at the top of the Execution page informing you that the current execution is obsolete. You will be prompted with two buttons: Reset and Merge.


Reset Execution
...