
Page History
| Table of Contents |
|---|
Overview
You can either execute your tests manually or automatically. Even if If it is an automated test, you can still manually set the test status for that execution. You can also create custom statuses.
Tests are always executed within a Test Execution context, even if it's an ad hoc execution. You can execute tests inline (i.e., define the test run status), directly in the Test Execution issue screen, or you can use the Execution Screen, which is detailed extensively below.
A Test Execution is validated validates if all the Tests that verify the in a specific environment target passed. In order to execute, monitor the progress, and report the results, each Test has its own Execution page details. Each Test associated with a Test Execution is called a Test Run. A Test Run is like an instance of the Test that contains a copy of the test definition (e.g., description, steps) and the result of that test in the context of that Test Execution.
When a Test definition is modified, the respective Test Runs aren't automatically updated. This happens is because the execution of a Test depends directly on its definition. If the Test definition is changed, the executions might not be consistent with the definition anymore. Each time a Test Run is created, the Test definition is copied to it. This guarantees that when the Test definition changes, the Test Runs are not affected and will always contain the original (i.e., when it was added to the Test Execution) Test definition.
...
- you have permission to "Browse" the Test Execution issue
- you have permission to "Resolve" the Test Execution issue
- the Test Execution issue is not in a status configured to disallow executions
- the Test issue is not in a status configured to disallow executions
| Info | ||
|---|---|---|
| ||
Find more about how you can disallow executions based on the workflow status of Test or Test Execution issues at: |
Even though you might not have permission to execute a Test Run and if the execution has already been started, you can see the execution details page in read-only mode. An informative message will be shown to at the top of the execution page if the current Test Run is in read-only mode.
Execution Screen
When you execute a Test, the Xray Execution Screen is shown. This screen is accessible from the Test Execution issue view page and the Test issue view page (Test Runs section), and this is where the execution results are displayed and registered. This page contains information about the Test definition and the Test Execution issue context to allow you to execute the Test without exiting this page.
The execution screen is composed by the following sections:
| Table of Contents |
|---|
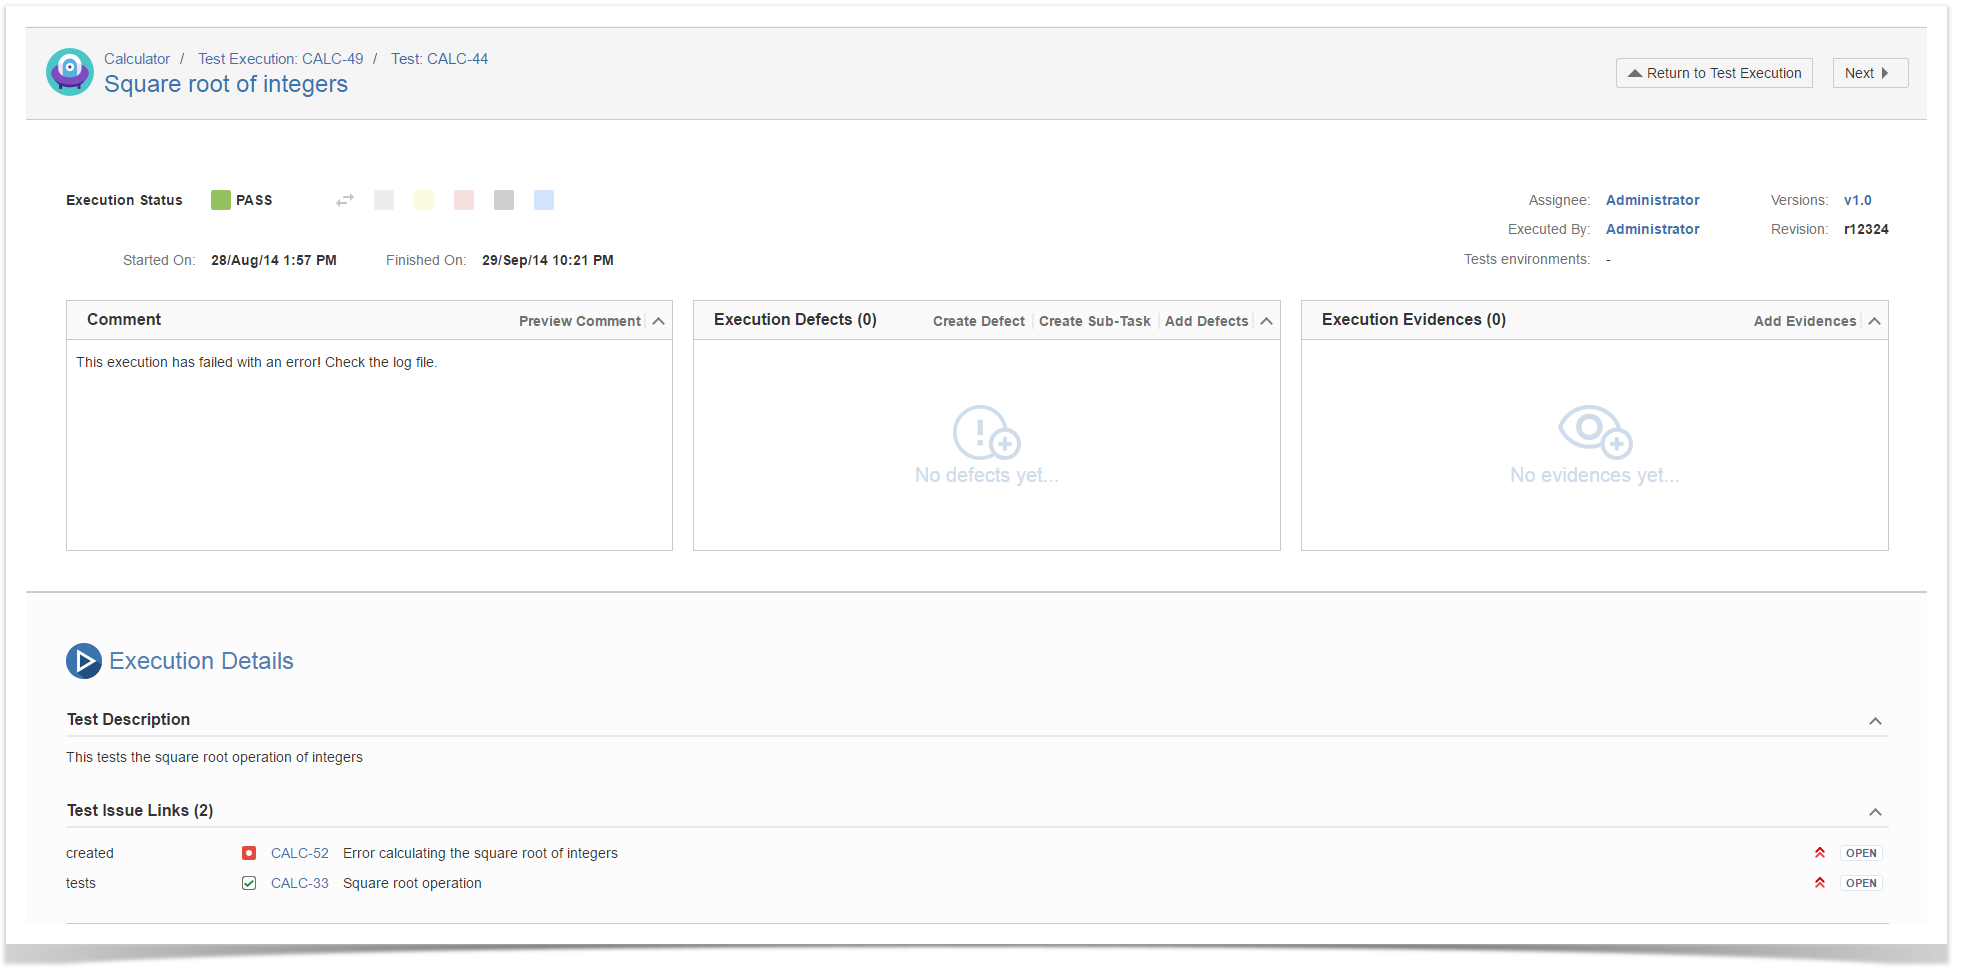

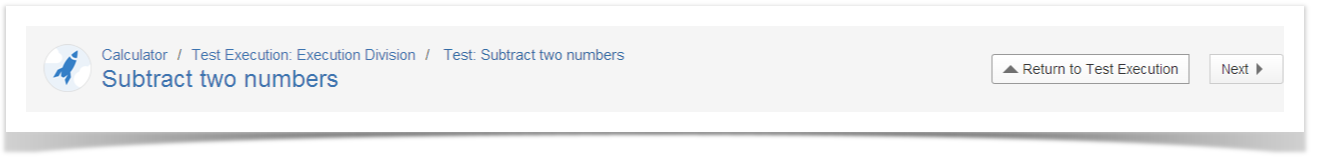
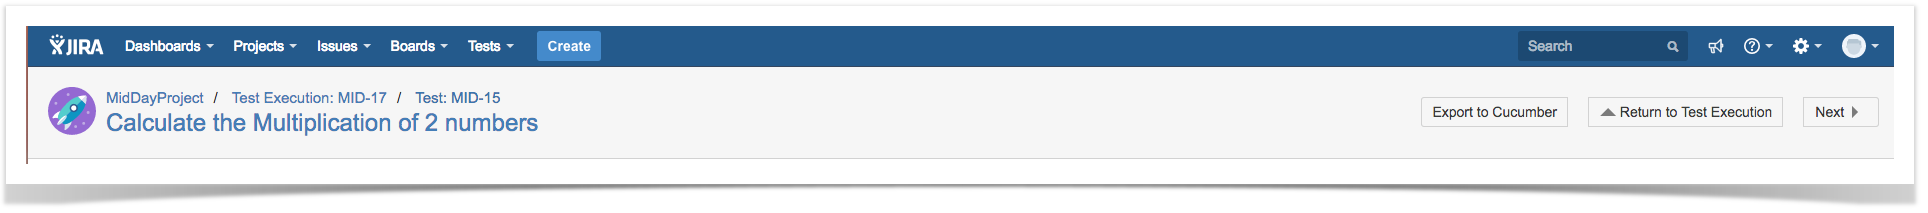
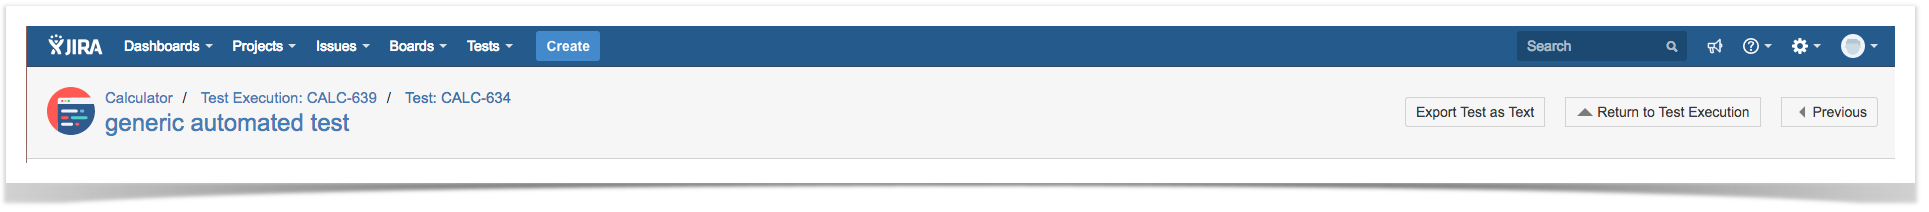
Navigation bar
divide in 5 sections. The first one is Navigation and Actions bar, then the Execution Status and General Information, after that the Findings section, the Test Details and Activity sections:

Navigation and Actions bar
This bar is always available to allow you to navigate Always available, the navigation bar contains breadcrumbs to allow easy navigation between the Test issue hierarchy. It also contains a toolbar with the Return to Test Execution button that allows you to jump to the current Test Execution issue page, as well as the . The Next and Previous buttons , allow you to quickly navigate to the execution screen of the other Tests included on in the same Test Execution, if applicable.
Export Automated Test Definition
If you are executing an automated Test, you can export its definition right from the execution screen.
On this bar, you can also find actions to Export test definitions and Import execution results. This is useful if you need to do an ad-hoc execution for an automated Test. Usually, automated tests are executed in a Continuous Integrating platform and the results are imported automatically into Xray (creating new Test Execution issues for the results) but you can also execute each automated Test individually and import the execution result.

Export to Cucumber
If you're executing a Cucumber Test, an option to export the Test as a feature file will appear.
Generic
If you're executing a Generic Test, then an option to export the Test as text will appear.
Import Execution Results
If you already have the test results, just use this action to import the report files into Xray and update a specific Test Run.
Dataset
If you want to edit a test run dataset, you can do it by clicking on the Dataset button. To learn more about it click on Parameterized Tests.
Exploratory App
If your test is an unstructured test, that option will appear and if clicked the Exploratory app will open. To learn more about it click Exploratory App.
Execution Status and General Information
...
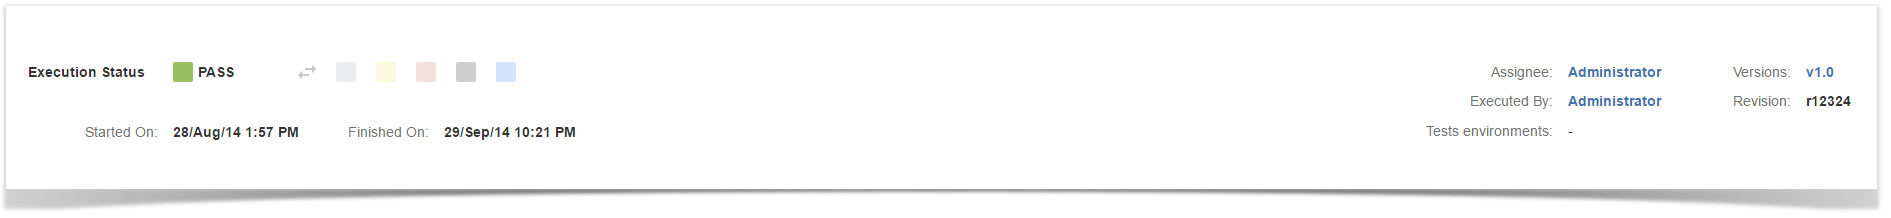
The Execution Status describes the current Test progress. The possible (native) status for a Test Run are TODO, EXECUTING, FAIL, ABORTED and PASS. You can also create custom statuses in the Xray Execute Tests administration Test Statuses Settings global page.
You can change the status of the execution directly through this field. It supports inline editing and once activated, it will display a set of statuses that you can set the Test Run. If the option for setting the Test Run status manually without having to execute all Test Steps (or Examples, as in the case of Cucumber Tests) is enabled in the Xray administration page, then you can set the Test Run Status to any status, independent of the current aggregate status of the Test Steps (or Examples). If this option is disabled, then the status that you can set through this field will be limited to the available transitions based on the current Steps or Examples aggregated statuses.
The status section contains other relevant fields such as:
- Timer - The time elapsed since the last time the timer started and the total time logged into this execution
- Assignee - the User assigned to perform the current test execution
- Executed By - the last User that changed the status of the current test run
- Versions - the target release version tested by the current test execution
- Revision - the source code and documentation version used in the current test execution
- Started On - the date and time the execution of the current test started
- Finished On - the date and time the execution of the current test finished

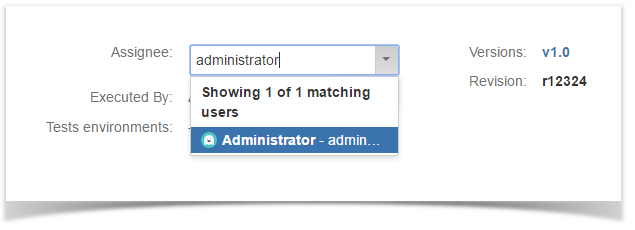
You can change the Test Run assignee directly on the field. It supports inline editing and once activated, you can filter by user and then select the one you wish want to assign to the Test Run.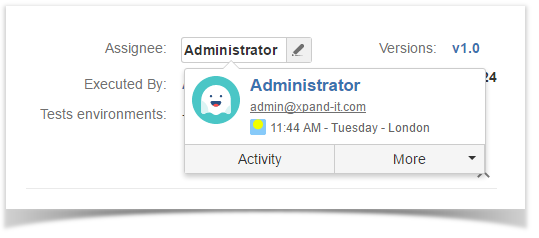


| Info |
|---|
After assigning a Test Run, an email notification is sent to the new assignee if the corresponding setting is enabled in the Global or Project Settings. |
If the dates are configured to be edited, you can edit the Started On date by clicking in the calendar icon and choosing the date and time. You can check your configurations by going to Jira Administration > Add-ons > Global Preferences.
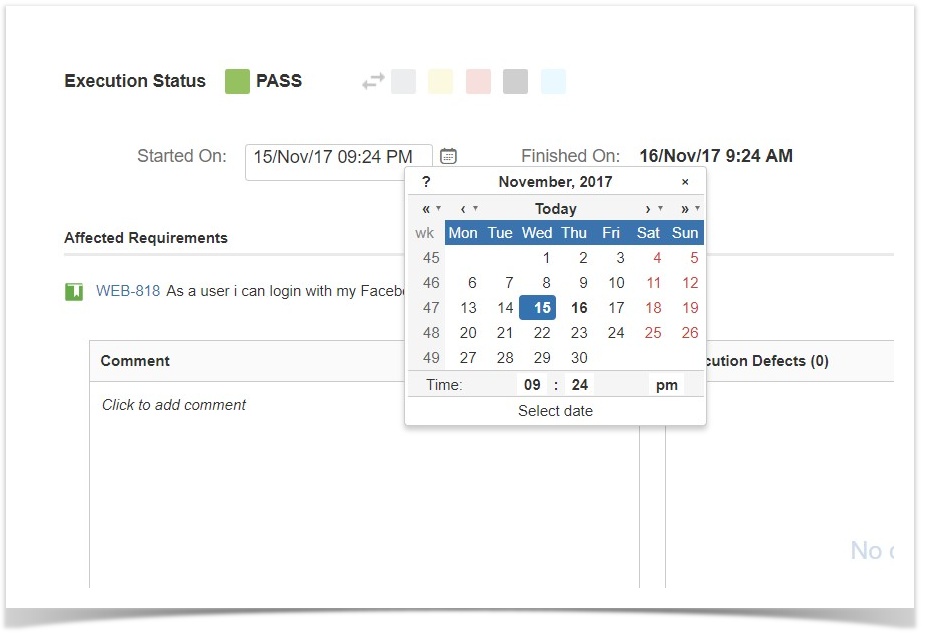
Note: The Jira jira.date.time.picker.java.format and jira.date.time.picker.javascript.format properties in Jira Administration advanced settings should belong to the same pair of properties in order for the datetime picker work properly. See the following link for more information
Affected Requirements
This section provides the ability to manually set the status for Requirement issues that are tested by the current Test issue. By default, the requirement status is calculated based on the latest Test Run of each Test associated with a given requirement. Even though the Test Run status is FAILED, not all requirement issues associated with the Test issue might have failed. Some of these requirements can, for instance, be PASSED, if the tester chooses to explicitly set the requirement status. This functionality makes it possible for a single Test issue to test multiple requirement issues with different concerns and functionalities. These requirement statuses that are explicitly set in a Test Run will then be considered when calculating the Requirement Status and Requirement Coverage.
| Info |
|---|
This section is only visible if the "Separation of Concerns" option is disabled in Requirements Coverage settings page. |
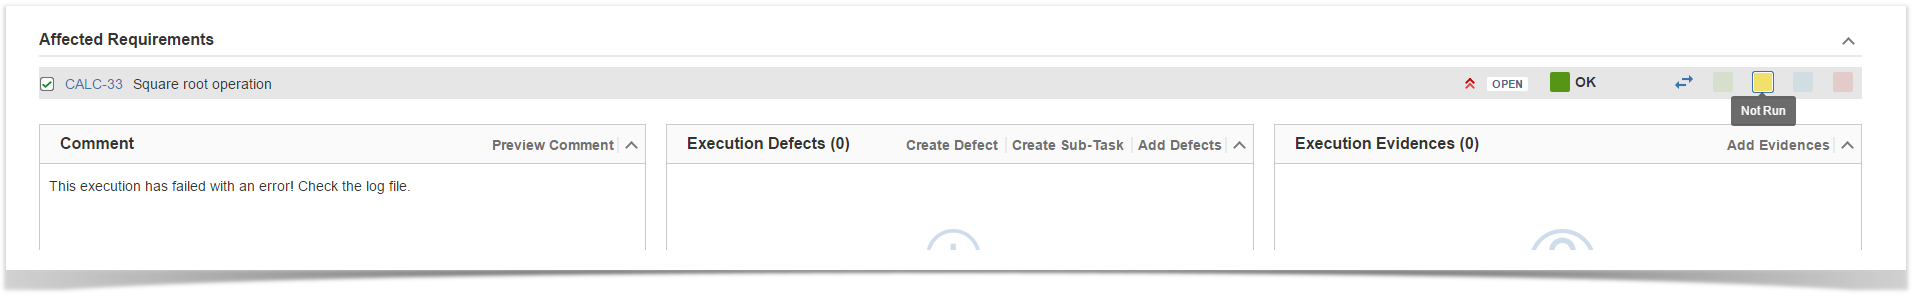
All affected requirement statuses will be updated whenever a step (or example in the case of Cucumber automated Tests) status is changed. The status for any affected requirement can always be changed by clicking on the status and choosing the desired option.
Execution Defects
Miscellaneous.

Timer

The timer is used to help the user track the time spent in the execution of the test.
This component will only be visible if the corresponding setting is active in the project settings.
The timer itself can be started, paused and reset manually using the button to do so:
You can also edit the value on the timer by clicking on it if the Set the value of the Time Tracker setting is active in the project settings.
The timer will also automatically start when the status of the Test Run changes to Executing and it will pause when it changes to a final status (i.e. Passed, Failed), it will also reset when it the Test Run changes to Todo.
Below the timer there is a component that tracks the time logged for this execution:

By clicking on it, you can log more time into it:
Time added in this dialog will be added to the work log of the respective Test Execution:
Findings
This section is where the Defects, Evidences, Comments and Custom Fields added are displayed.


Defects
This field lists the overall and step defects related to The Execution Defects field lists the overall defects related with the current execution. It is possible to create a Create new Defect issue, create a new Sub-task issues (or sub-tasks) or Add existing Defects by clicking on the respective option.
Execution Evidences
the respective option.

Group Defects
"Show Steps Defects" is an option that you can see in Manual tests, that allow you to see overall defects and defects associated with steps in the same panel.
This feature is optional and you can enabled/disabled it on the respective panel section.
Example:
When the toggle is on, both defects appear in the panel and a label (Global/Step/Iteration + Step) is shown at the start of the defect line to easily distinguish each of them. When turned off, only the overall defects are shown.
Show Steps Defects |
|---|
Toggle On
|
Toggle Off
|


Evidence
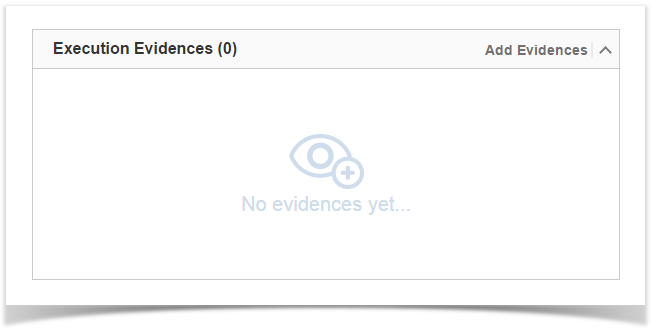
This field lists all the attachments related to the current execution. Clicking Add Evidence opens up The Execution Evidences field lists the overall attachments related with the current execution and clicking on the Add Evidences, opens the Attach Files dialog box.
Comment
Check here for more information about attachments.

Group Evidence
"Show Steps Evidence" is an option that you can see in Manual tests, that allows you to see overall evidence and evidence associated with steps in the same panel.
This feature is optional and you can enable/disable it on the respective panel section.
Example:
When the toggle is on, all evidence appears in the panel and a label (Global/Step/Iteration + Step) is shown at the start of the evidence line to easily distinguish each of them. When turned off, only the overall evidence are shown.
| Show Steps Evidence |
|---|
Toggle On
|
Toggle Off
|


Custom Fields
You define additional custom fields for Test Runs. These fields can be useful to add extra information to Test Runs, usually only available when or after executing Tests.
Test Run custom fields can be configured by project and by Test Type. Therefore, these settings will not affect other projects within your Jira instance. For instance, it is possible to have custom fields just for Manual Tests within a project.
If there are any custom fields defined for the scope of the Test Run, they will appear on the "Custom Fields" section.

It is also possible to define custom fields that are mandatory. If this is the case, users will not be able to set a final status on the Test Run if there is any required custom field that is not populated.

Comment
This field is inline editable so you can input comments The Comment field is inline editable to input overall appreciations about the current execution without reloading the page.
The field supports It supports the Jira markup wiki language.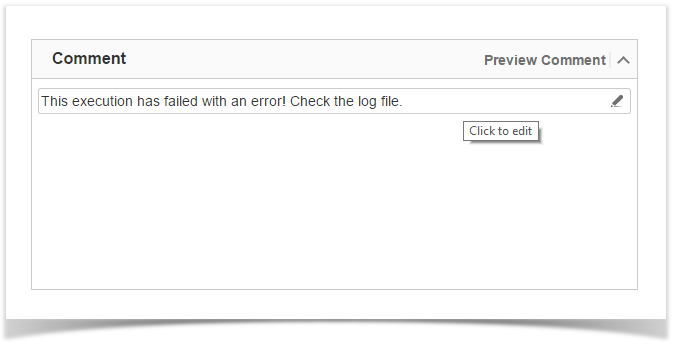

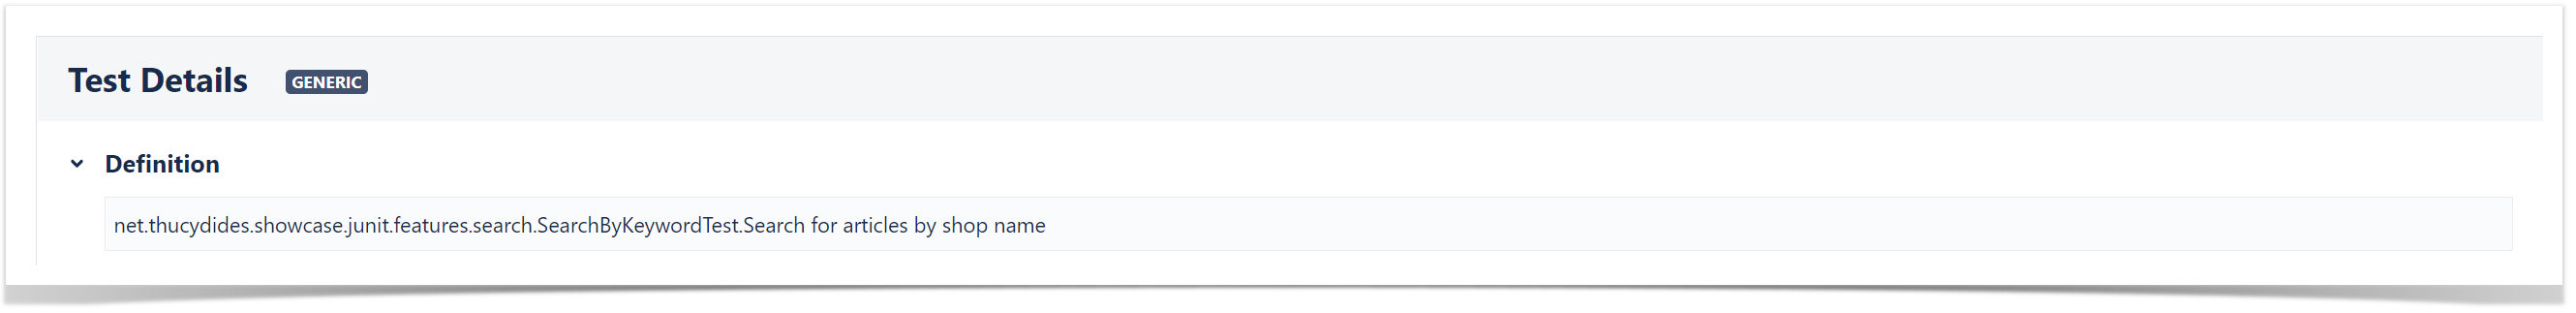
Test Details
This section includes some fields present on the Test issue. It often contains useful information for testers to execute the Test.
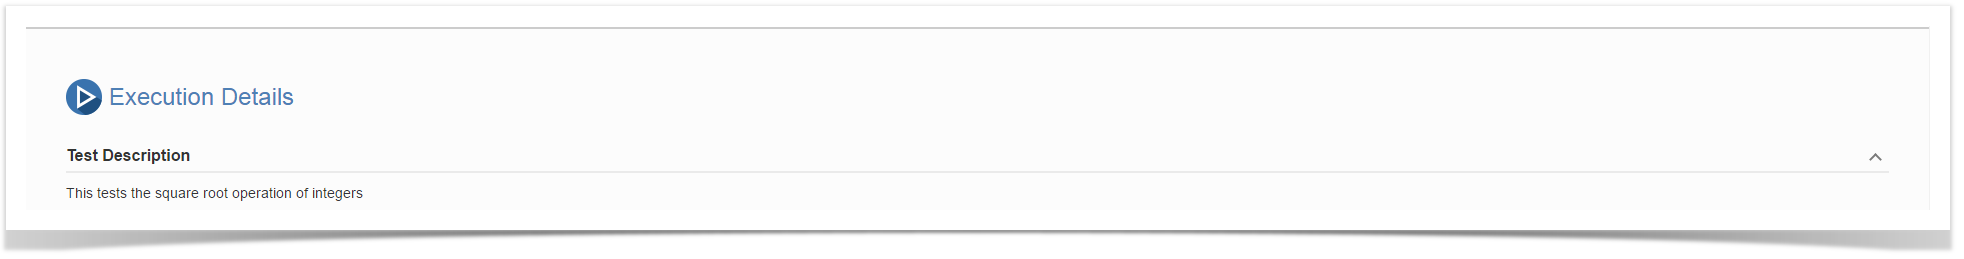
Test Description
This section includes the current Test issue description. The Test issue description It often contains useful information for testers to execute the Test.
The This field supports the Jira markup wiki language.

Test Issue
...
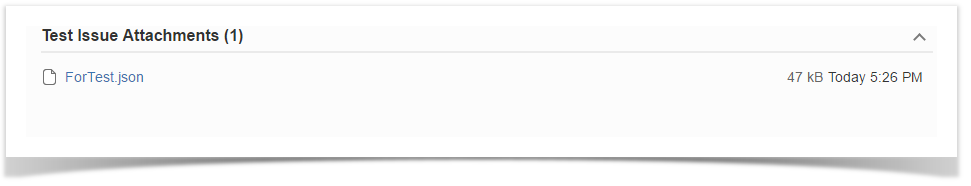
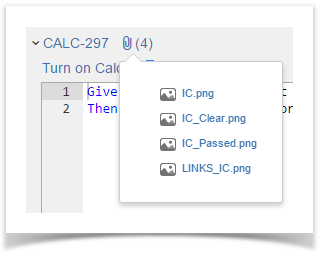
Attachments
This section shows all links attachments associated with the Test.

Test Issue
...
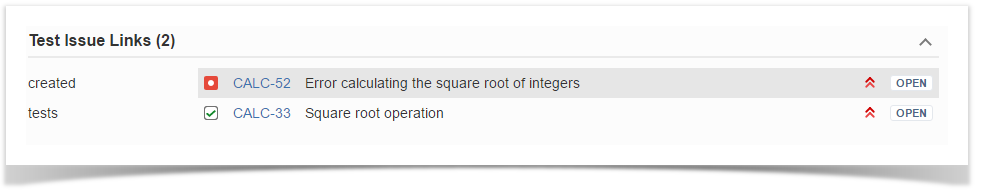
Links
This section shows all attachments links associated with the Test.
Pre-Condition

Parameters
This field shows the parameters' values defined in the dataset when there is only a single row in it. To learn more about it click on Parameterized Tests.

Preconditions
This field shows the Preconditions The Pre-Condition field shows the Pre-Conditions issues associated with the current Test.
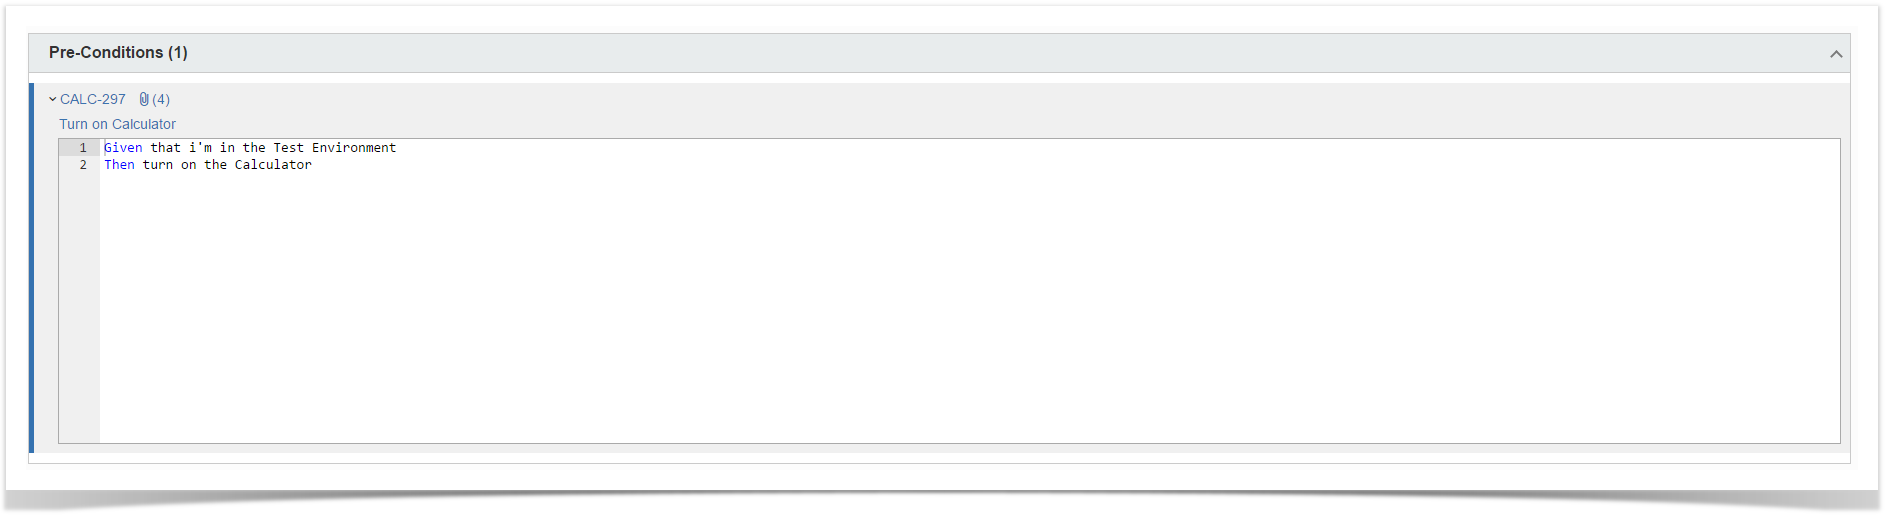
Pre-Condition Attachments
The Pre-Condition field also shows the Pre-Conditions attachment in a inline dialog.

Steps/Definition/Scenario or Scenario Outline
Within that section, you will find the Test script to execute. Depending on the Test Type, this section can display Steps (for manual Tests), Definition (for unstructured Tests), and Scenario or Scenario Outline (for Gherkin scenarios).
Manual Test Step Results Table
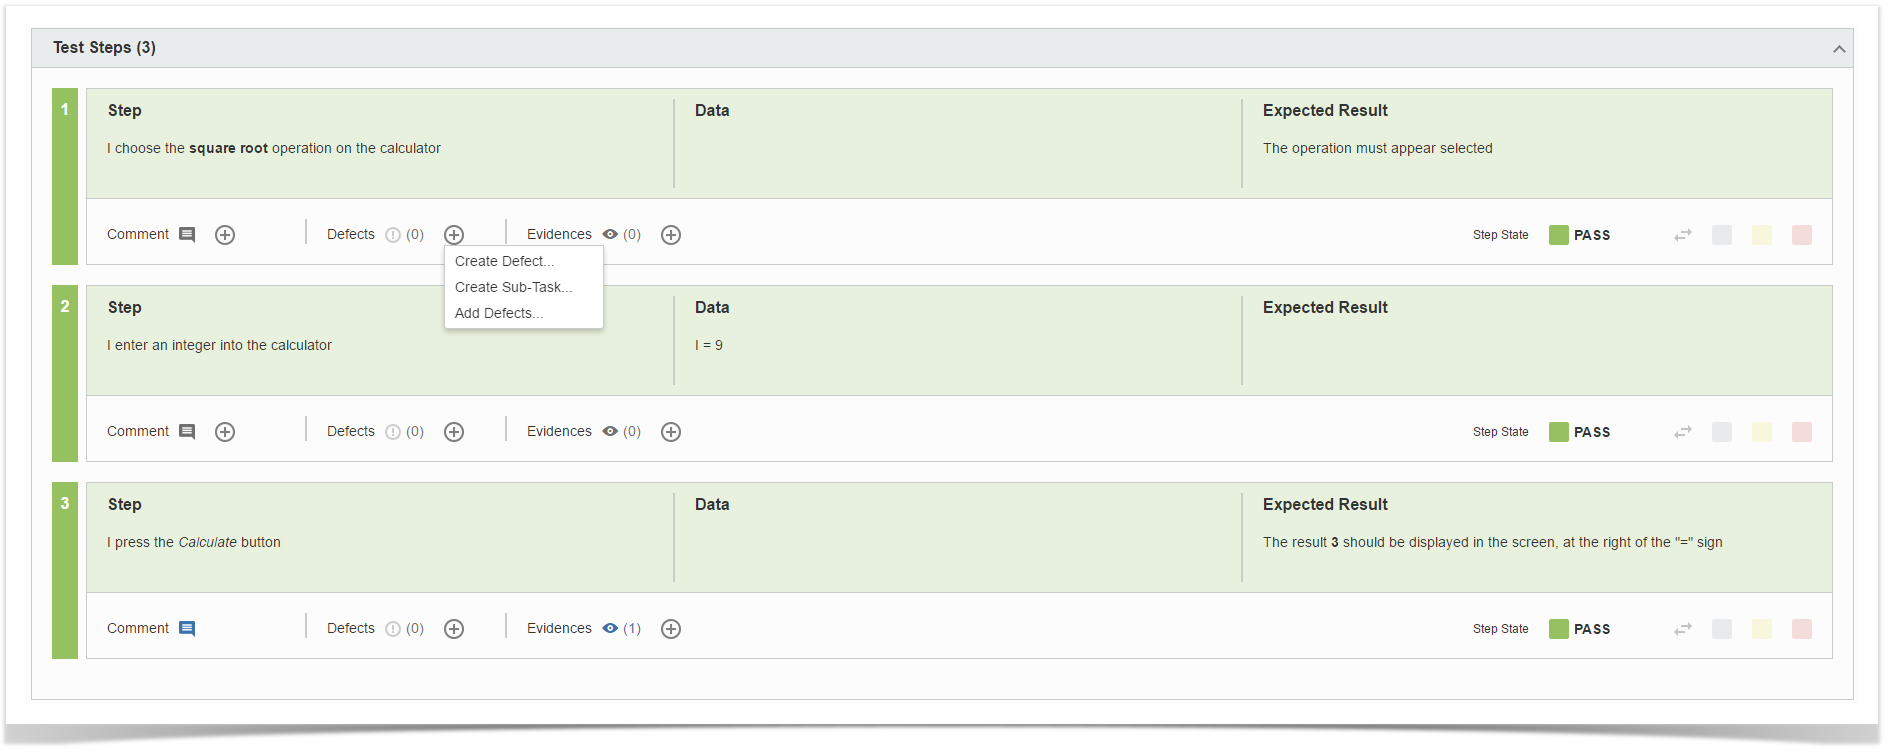
A Manual Test execution screen contains the Test Steps field, listing with the Steps, Data, Expected Result and Attachments Action, attachments and all the other configured fields to be used as a reference while testing. The Test Steps field configuration used is the one defined in the Test Run's Test project.
By clicking on each step, the following fields become editable:
- the Actual Result field which contains the actual result of the execution of the step;
- This field can be edited using the WYSIWYG markdown editor.
- It's possible to refer to an Evidence previously added to any Step or Global execution
- the Comment field, which contains any notes about the corresponding step;
- the Defects field, which contains any defect associated with the corresponding step. It is also possible to input new defects by clicking on:
- Create Defect to create a new Defect
- Create Sub-
- Defect to create a new Sub
- Clicking on the- -Defect (sub-task)
- Add Defects to add an already existing defect
- the Evidences field, which contains any attachment associated with the corresponding step. It is also possible to input new attachments by clicking on the + button, which opens the Attach Files dialogue box
- the Status which , which contains the current step testing status. This can be changed by clicking on any of the status statuses in front of your Step Status.
Note: Changing the Status on the each Step will affect the Execution Status field on the Execution Screen.
Automated Test Details
An Automated Test execution screen contains the Automated Test Details field, which list the Steps to be used as reference by the external tool while testing.
Examples

Gherkin Tests
Gherkin Tests always display the Test scenario on the execution page. Usually, these tests are automated and their result can be imported into Xray. However, it is also possible to execute these Tests manually by setting the overall result of the Test Run, or by setting the result of each example (in case of scenario outlines).

Examples
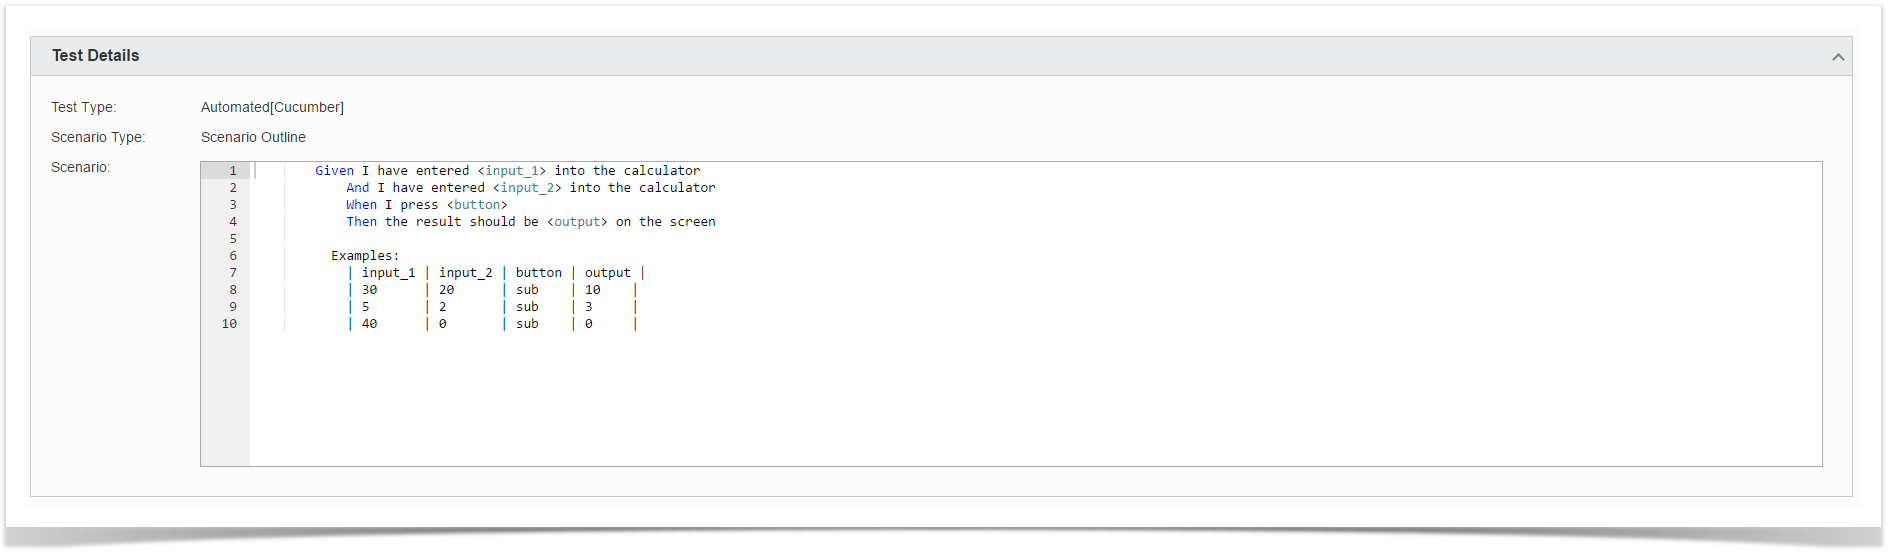
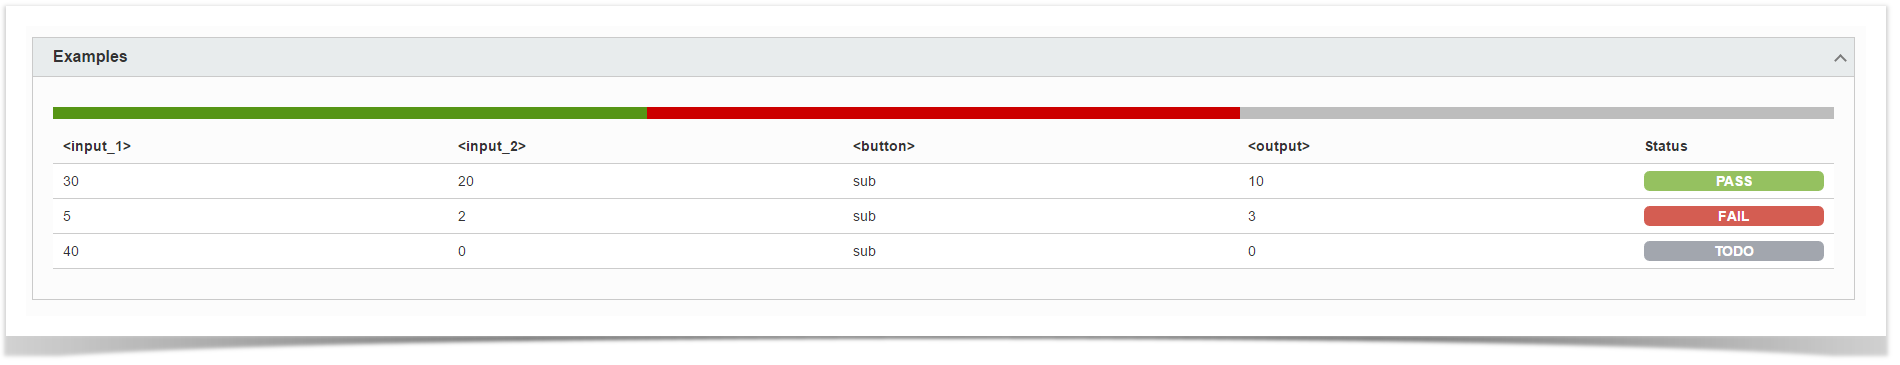
A Scenario Outline contains a table of examples that define A scenario outline of an automated Cucumber test will normally contain an examples table containing several inputs and outputs for the given scenario. Each example is, therefore, a set of values that will be replaced on the scenario.
The examples section details these examples, containing an overall status bar in the header and a table with all the examples below. Each example can have the status: PASS, FAIL, EXECUTING or TODO.
A scenario outline test is PASS only if all examples passed.
...
A scenario outline test is TODO if at least one of the examples did not run and all the other examples passed or todo.

Unstructured Tests
Unstructured Tests only contain the definition field on the Test Details. This field can specify a test script, an ID to an external (automated) test case, or an Exploratory Test charter. Similar to Gherkin Tests, most unstructured test results will be imported or set by another tool.
Results
However, it is also possible to set the status of unstructured tests manually.
Iterations
When this is a test run of a data-driven test, this field shows all the iterations corresponding to the rows of the dataset closest to the test run. For each iteration, the preconditions and steps appear with the expected parameter values for it. To learn more about it click on Parameterized Tests.
All operations for test steps are also available within an iteration, namely adding defects, evidence, and the actual result.
This section also features a progress bar displaying the status of all iterations.
Filtering iterations
It is also possible to filter the iterations by status. A filter button is provided next to the iterations progress bar. Clicking on this button will open a panel with all the available statuses. Choose one or more statuses and press Apply.
Status calculation
When a step status is changed, the iteration status will be updated automatically, according to the step statuses and, in turn, the overall test status will also be updated based on all iterations statuses.

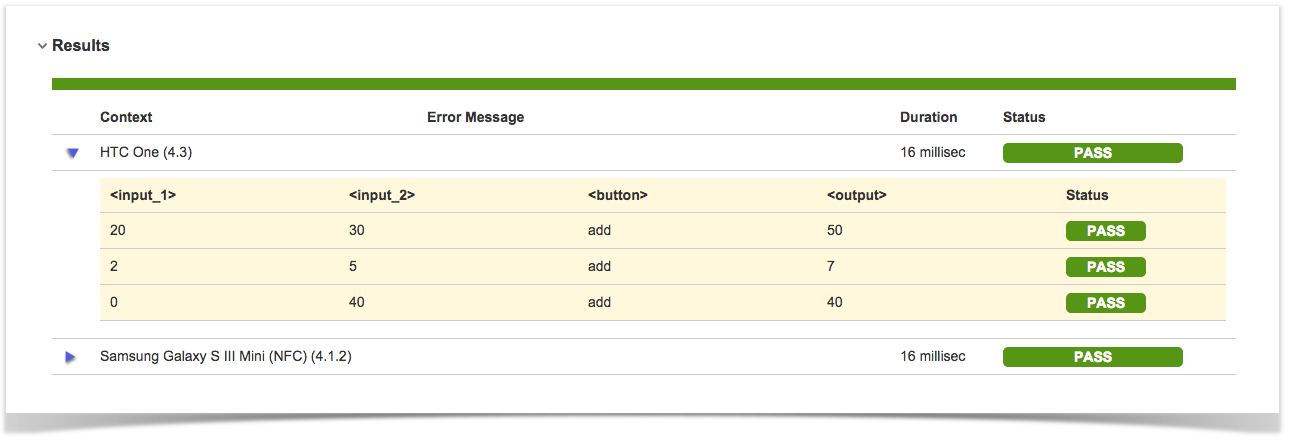
Automated Results
Xray Xray for Jira supports the import of multiple execution results for the same Test Run. Multiple execution executions for the same Test Run specify specifies different results for different contextcontexts/environments. Multiple executions are only supported for Automated Tests. Manual Tests do not have this concept, yet.
When a Test Run contains multiple executions imported from external sources like Calabash and Xamarin Test Cloud, these executions are presented in a "Results" section on the execution page.
...
- Context: An execution context name (in the case of Xamarin Test Cloud results, the mobile device, and operating system version)
- Error Message: A possible error message if the result has failed.
- Duration: The complete duration of an execution result.
- Status: The execution results status

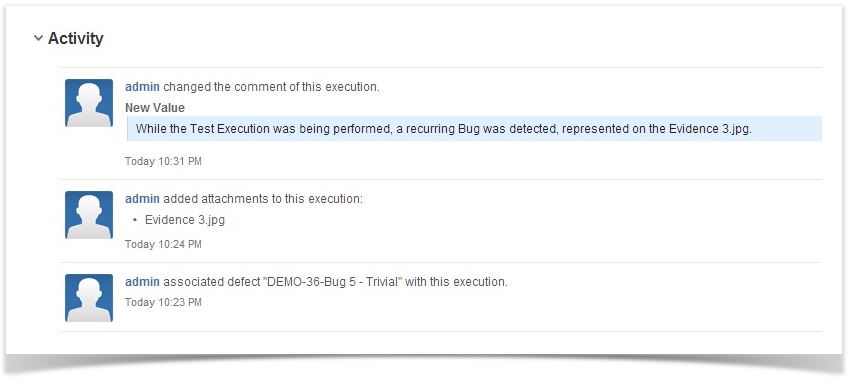
Activity
The Activity field lists all the activities related to the current execution.
...

For data-driven tests the iteration number will appear in the activity list:

Attaching Screenshots
To attach a screenshot, paste the image from your clipboard using the relevant keyboard shortcut. (For Mac OSX, use CMD+V; for Windows, use Ctrl+V.)
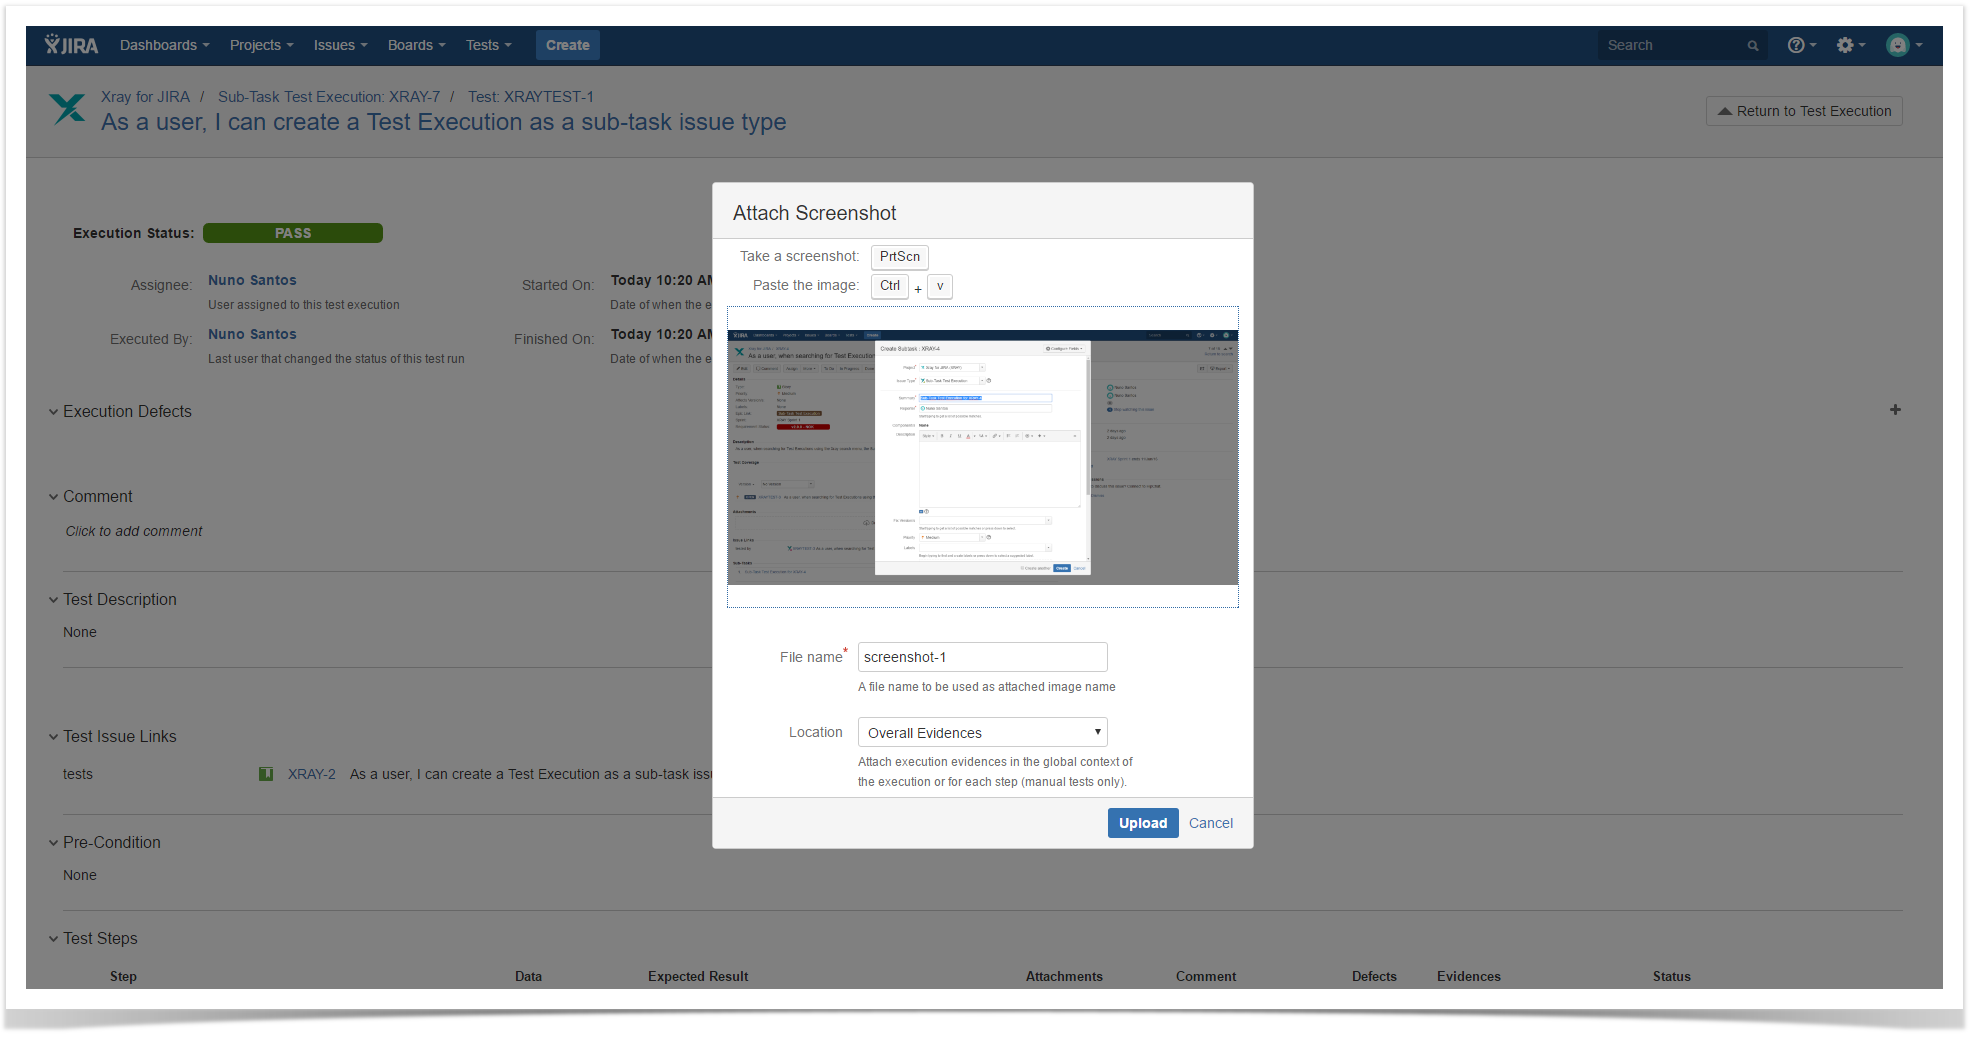
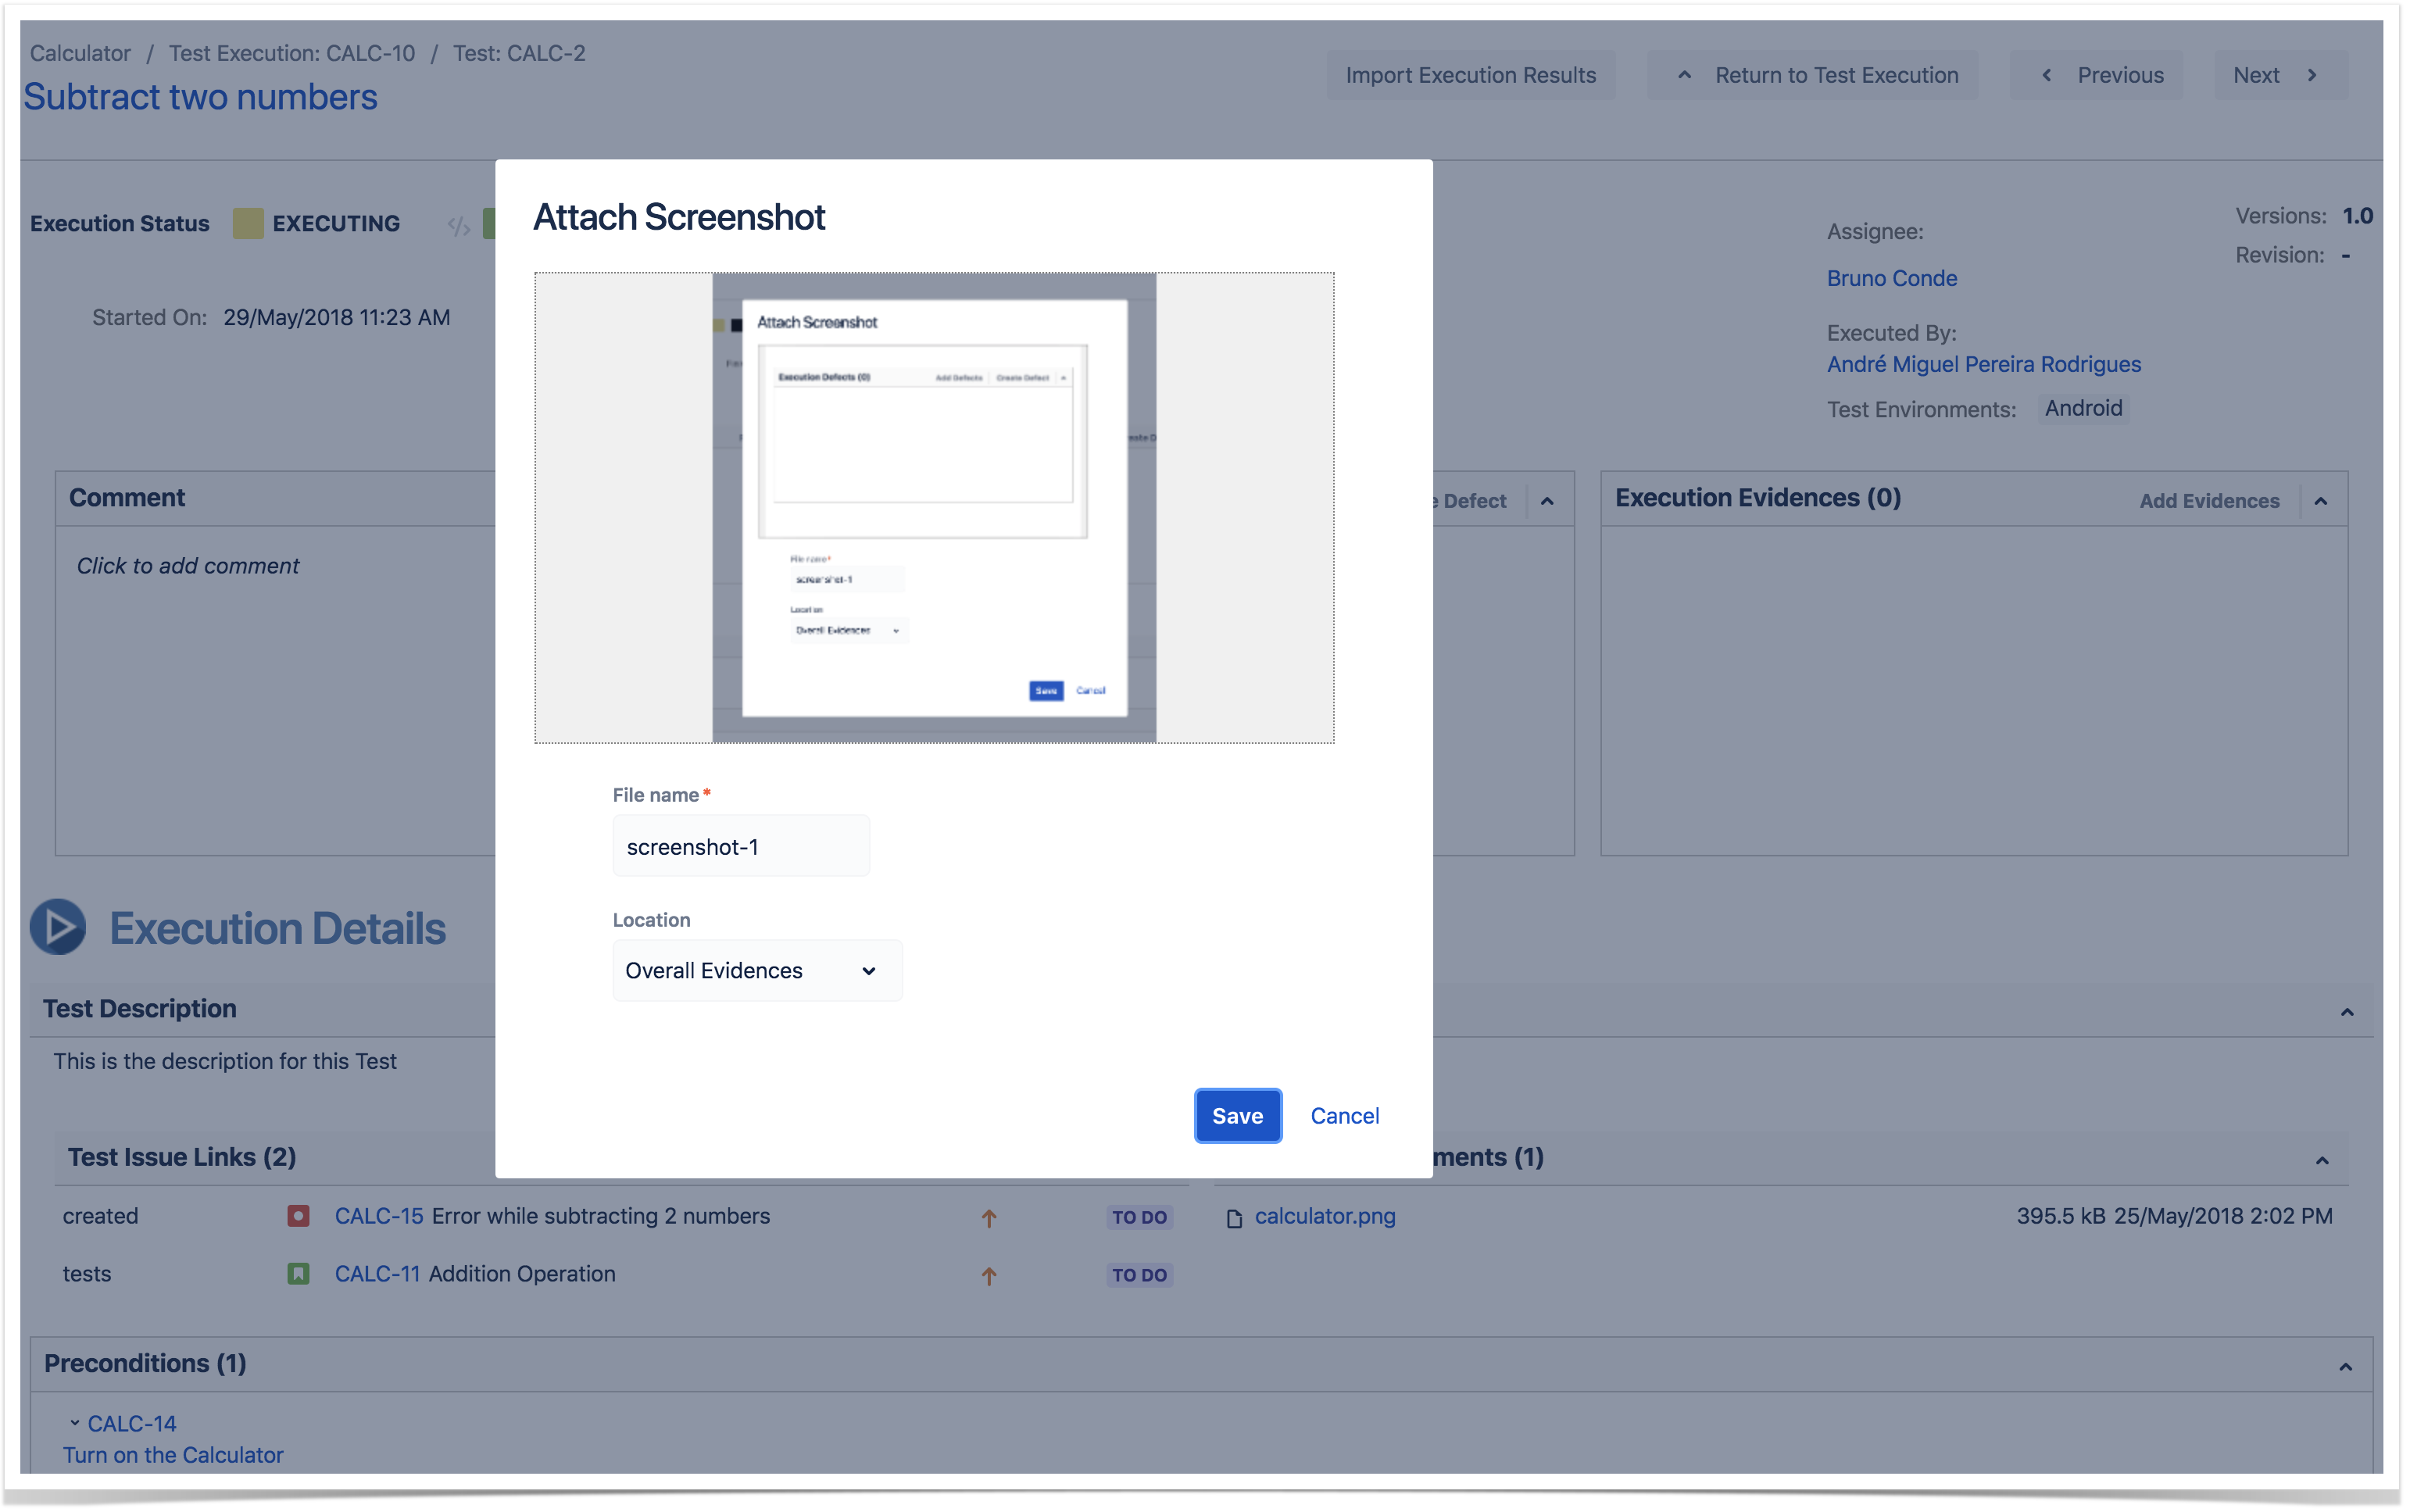
Enter a file name for the screenshot you are attaching (defaults to "screenshot-" concatenated with the next number available) and choose where you want to place the evidence (Overall Execution or Test Steps).
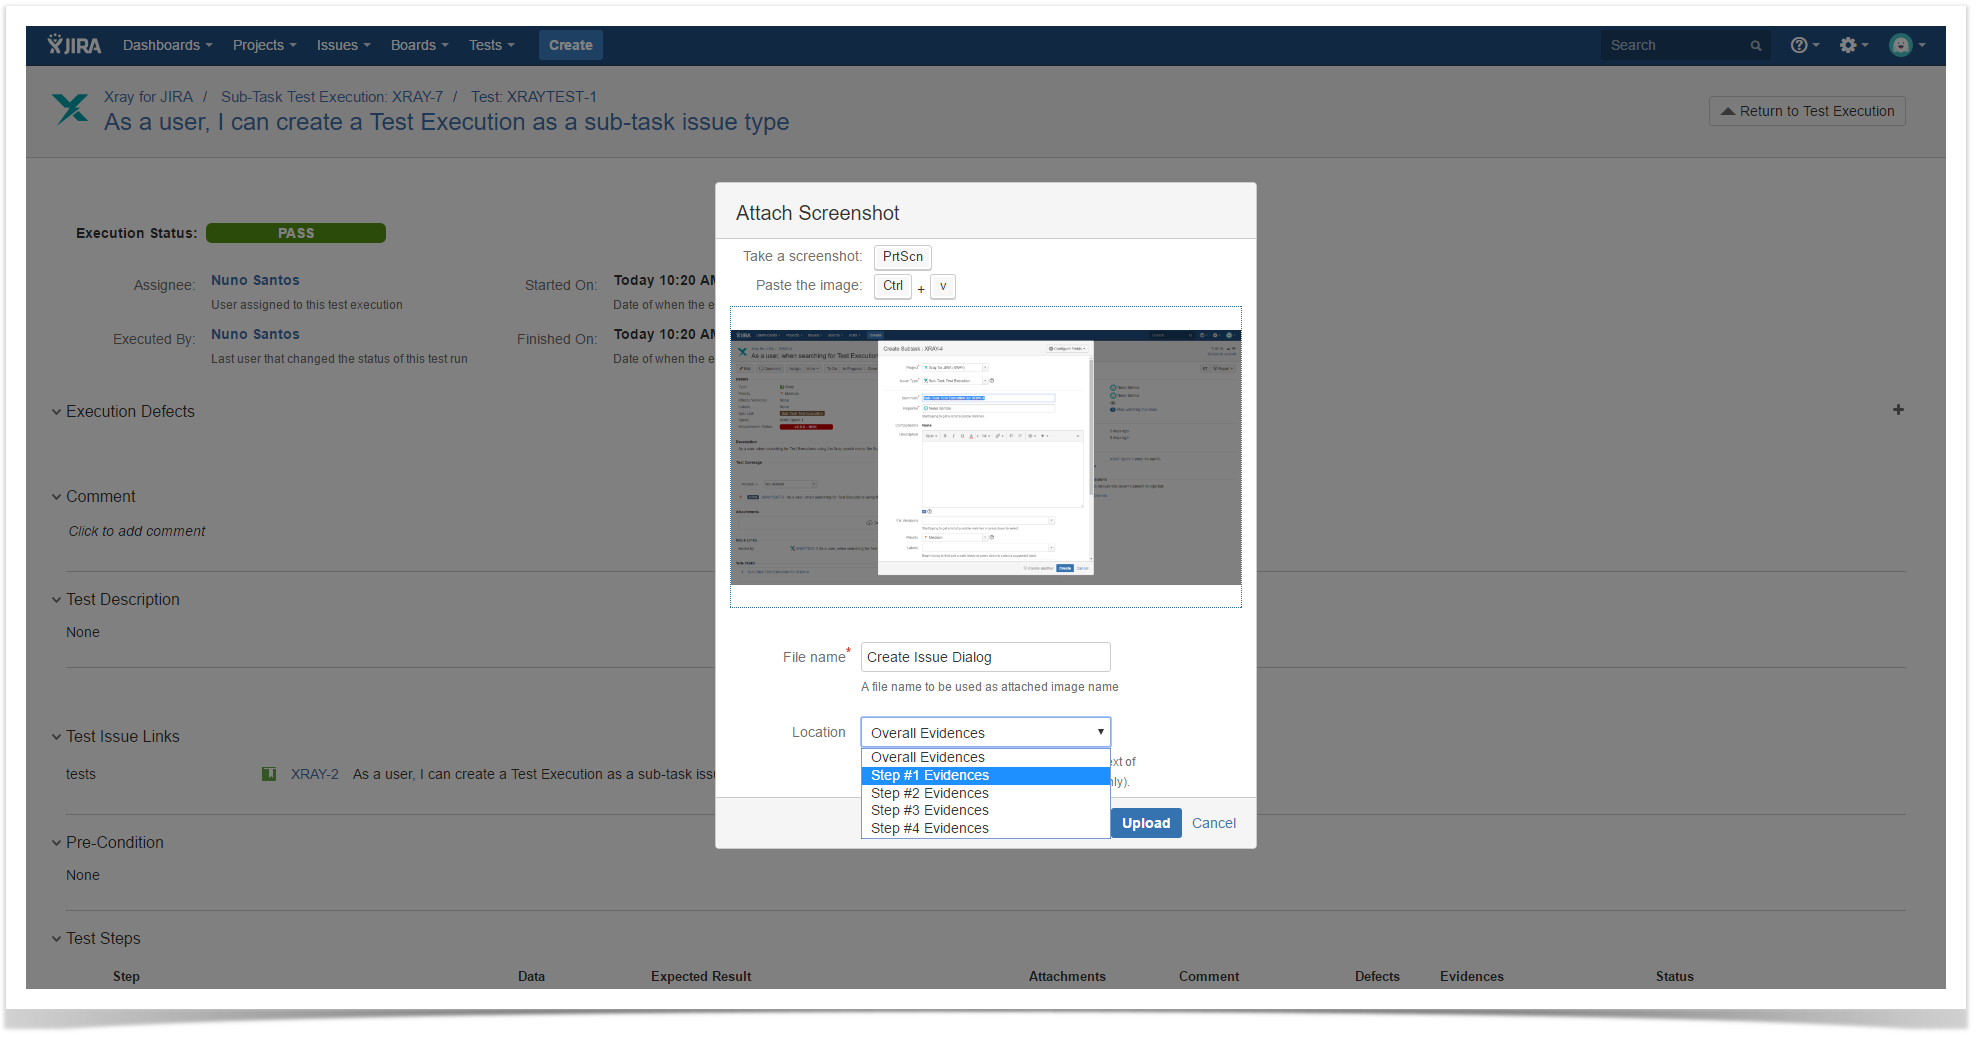
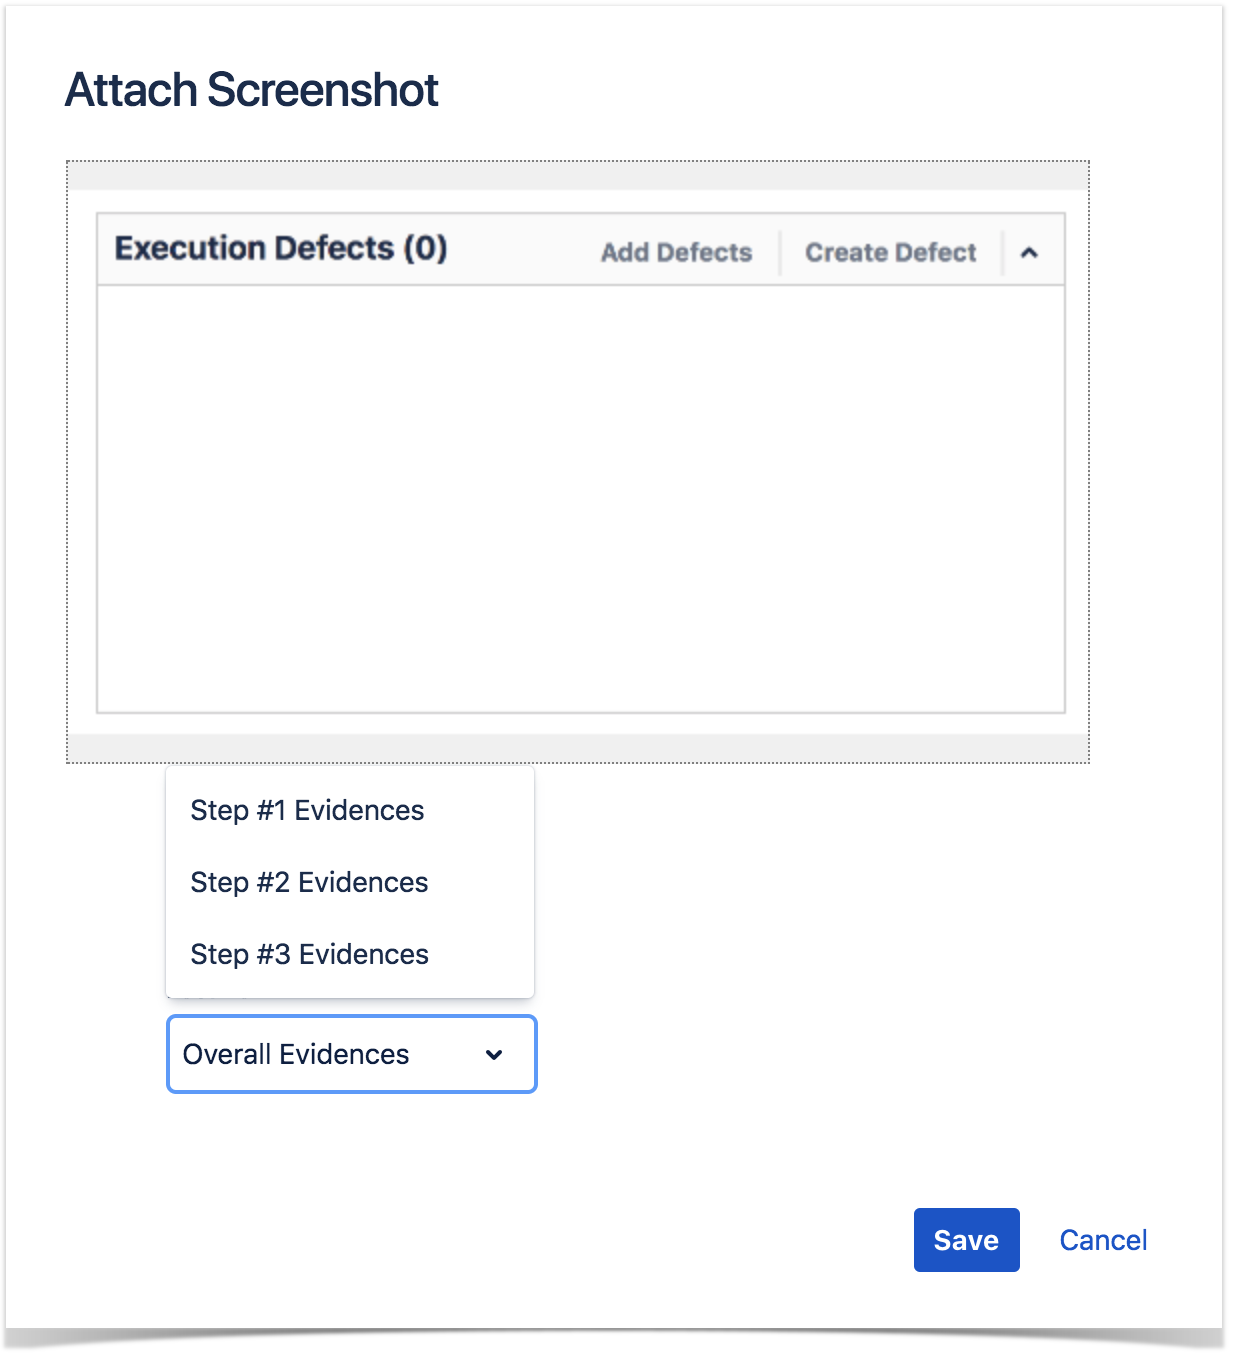
Click UploadSave to attach the captured image to your Test Run.
...
The Activity field lists all the activities related with the current execution.
Updating the definition of the Test after the execution started
When a Test definition has changed, a new dialog box will appear on at the top of the Execution page informing you that the current execution is obsolete, and will prompt you with Reset or Merge buttons that, when pressed, will load the updated definition as well as delete all the execution data or merge the new Test definition into current state of execution. . You will be prompted with two buttons: Reset and Merge.

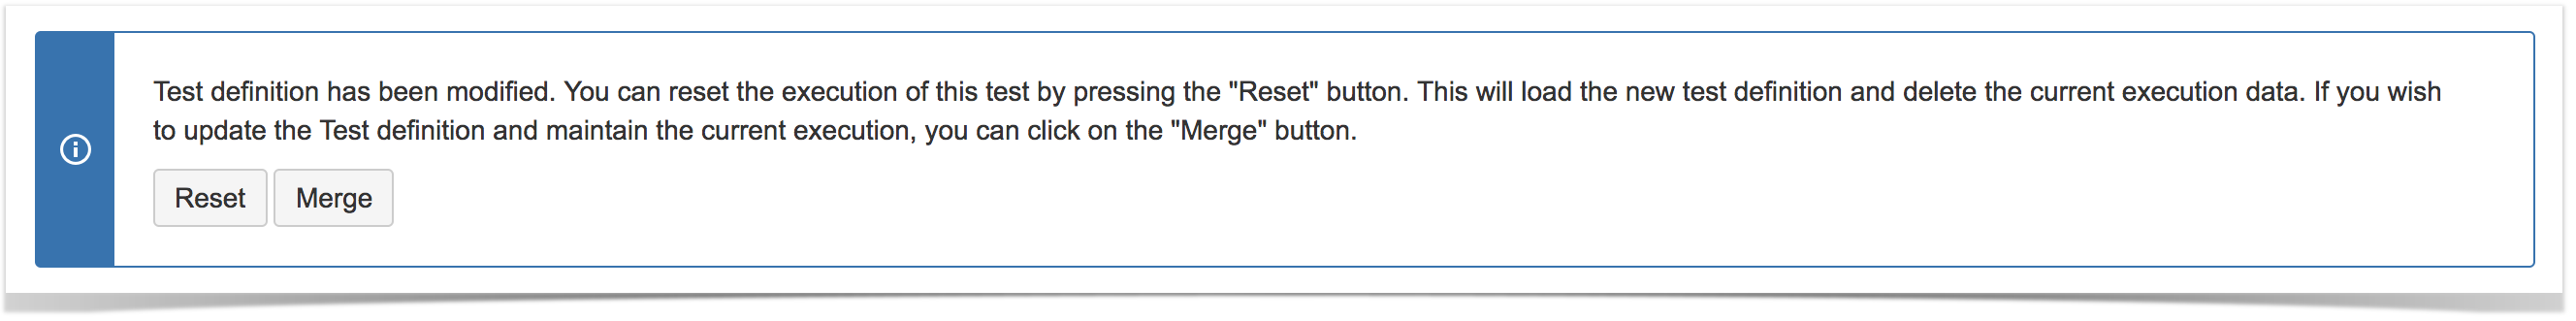
Reset Execution
You can choose to reset the Execution or keep it for historic record. If you reset the execution, all information previously saved (status, evidencesevidence, defects) will be erased.
Merge Execution
You can choose to merge the new Test definition into the current status of execution. This will keep steps that weren't changed along with the associated results/comments/evidencesevidence. It will also load new steps (moved, erased, or created), preconditions, pre-conditions or attachments definitions. This will always force a recalculation of Test Run Status. For instance, if the current Test Run Status is FAIL because of a step and this step is removed from Test, if you merge, then the Test Run Status will change to whatever the value combination of the others steps returns.
...