
Test Coverage Web Panel
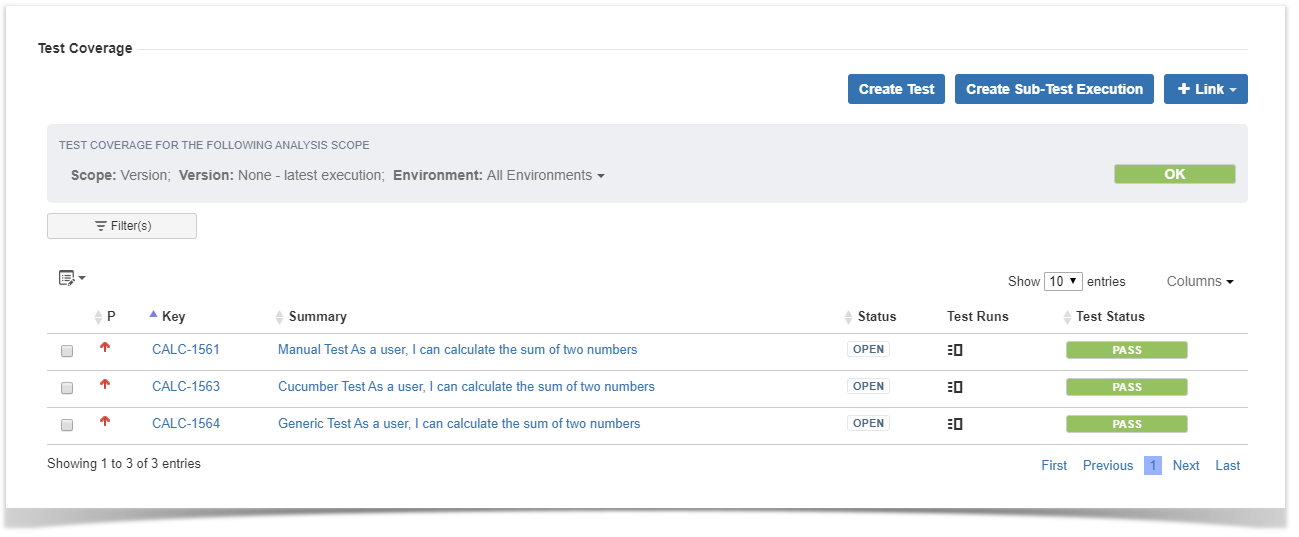
The Test Coverage Web Panel presents, in the context of a specific analysis scope, the respective Requirement status, the requirement linked tests and the Test Runs affecting a particular Test status.
In this panel, you can perform actions such as create a new Test or a Sub-Test Execution automatically linked to the requirement and/or link existing Tests and Test Sets to the requirement.
The listed tests can be filtered, sorted by manually added columns and removed individually or via bulk action directly on a paginated list.
Available actions
In the context of the requirement test coverage you can perform the following actions:

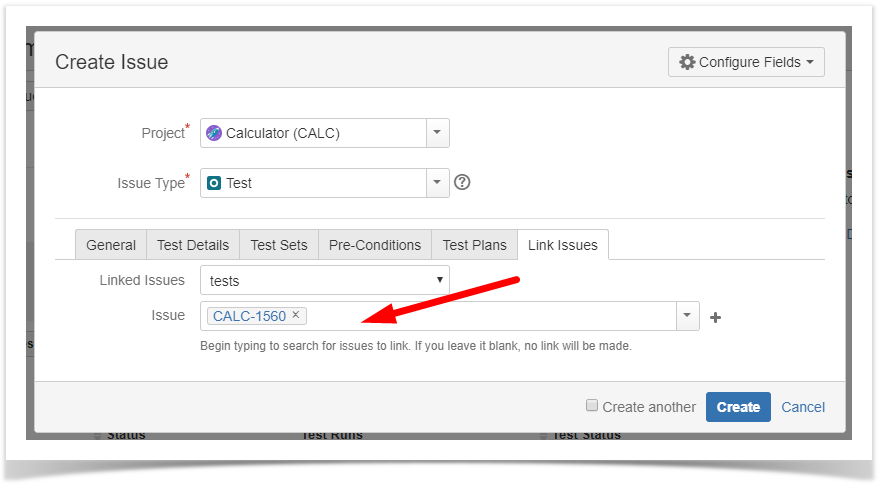
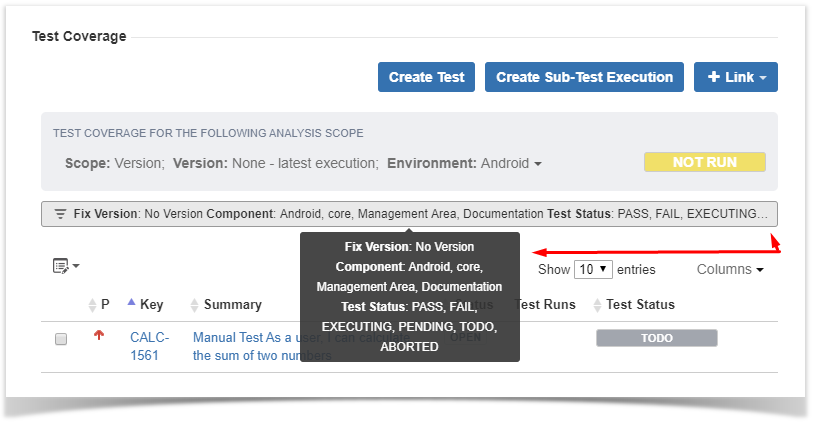
Create Test
This action allows you to access the create issue dialog, with some pre set field values such as "Test" issue type and link to the requirement issue.

Create Sub-Test Execution
This action allows you to create a Sub-Test Execution with some pre set field values such as the links to all the tests currently presented in the requirement test coverage.

Add Link
The Add Link option allows you to choose the issue type you wish to link to the requirement.
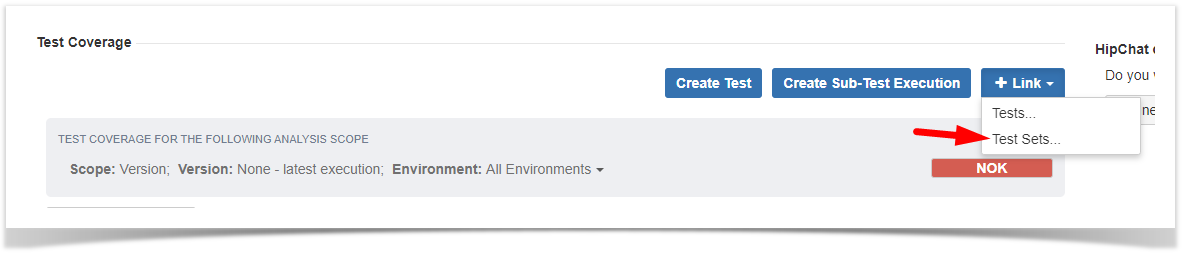
This operation can be performed using the Issue Picker Dialog where among others, allows you to search, performe multiple selection and add the selected to the requirement.

Analysis Scope
The Test Coverage Web Panel presents, in the context of a specific analysis scope:
- the respective Requirement status
- the tests linked to the requirement
- the Test Runs affecting a particular status of a Test
The test coverage analysis scope can be set per:
In combination with all or a specific Environment
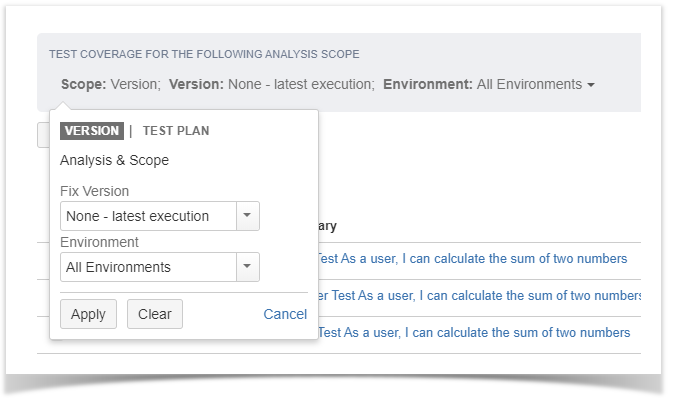
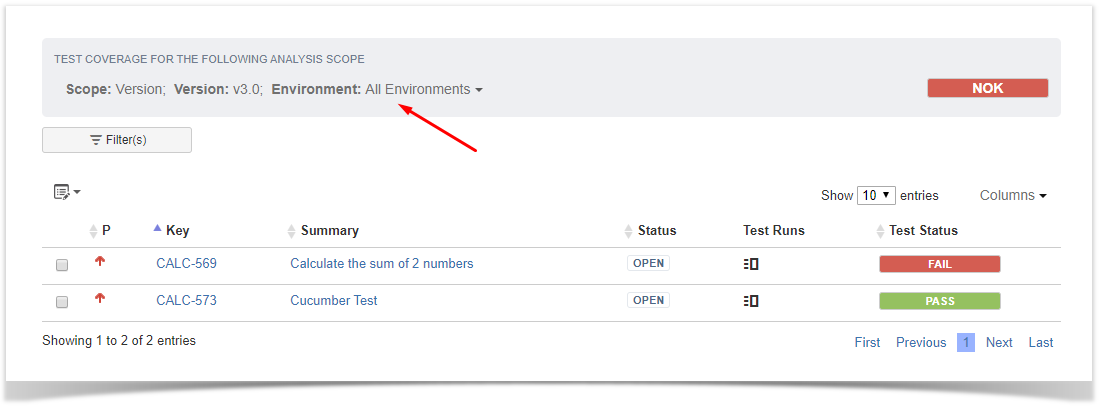
Version
When the analysis scope is set per version it allows you to see the Requirement status for each project´s version.

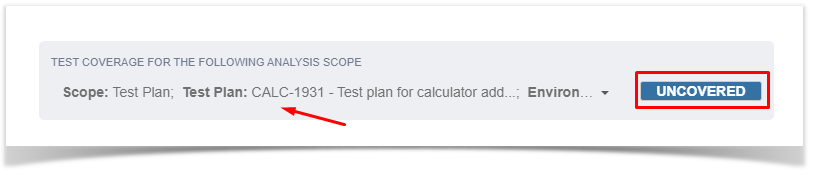
Test Plan
When the analysis scope is set per Test Plan it allows you to see the Requirement status for the selected Test Plan.
Environments
The statuses presented in the context of an analysis scope also depend on the Environments.
Therefore you can see both the requirement status and the test statuses based on the combination of scope and test environment you have selected.

Filter(s)
The tests presented as a result of the selected analysis scope can be filtered using a dynamic filter component.
The dynamic filter component has the following operating modes:
Basic
The Basic mode has a set of default fields but you can also search and select other fields from the More option.


Advanced
The Advanced mode allows you to search based on a specific JQL.

Summary view
The summary view presents the fields names and values applied in the active filter. When these exceed the available space "..." are added and all information is visible in the tooltip.

over t the list :
- filtered using a dynamic filter component
- sorted by the columns you can now add/remove to/from the list
- removed individually or via bulk action directly on the list
can see web panel